Difference between revisions of "Plot solid prob bands"
(image) |
(transparencyMask) |
||
| Line 5: | Line 5: | ||
<center>[[image:Solid prob band example.png]]</center> | <center>[[image:Solid prob band example.png]]</center> | ||
| − | == Plot solid prob bands (canv, info, roles) == | + | == Plot solid prob bands (canv, info, roles'', transparencyMask'') == |
Fills in a solid band behind a probability bands view. To be used from the OnGraphDraw attribute. Usage: | Fills in a solid band behind a probability bands view. To be used from the OnGraphDraw attribute. Usage: | ||
| Line 15: | Line 15: | ||
* Select the bands view for your result. | * Select the bands view for your result. | ||
* Make sure you have Color=.Probability for the pivot. | * Make sure you have Color=.Probability for the pivot. | ||
| + | |||
| + | The function uses the lower percentile color (for example, for the 5- to 95-percentile fill, it uses the color for the 5-percentile, with the transparencyMask applied. The transparency mask in an integer between 0 and 255, where 0 (or null) is fully opaque, and 255 is full transparency (invisible). The default is a «transparencyMask» of 128. Because transparency blends the colors with the white background and with the solid bands behind a given band, the actual colors match the colors of the key exactly only when a «transparencyMask» of 0 is used. However, without transparency, the underlying grid no longer visible. | ||
== Library == | == Library == | ||
Revision as of 00:55, 19 March 2019
New to Analytica 5.2
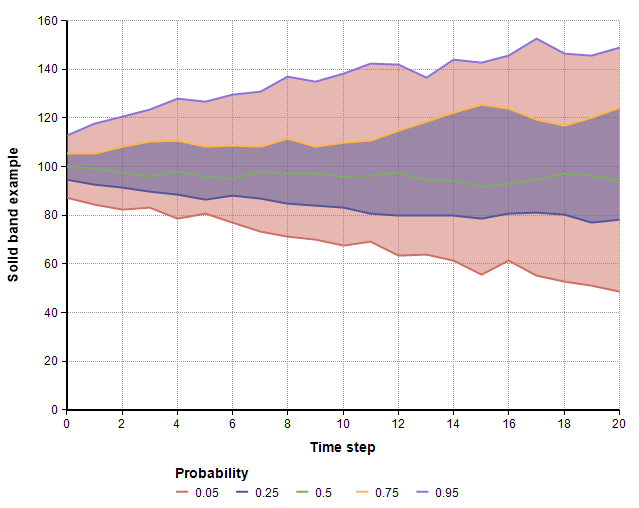
Use this function from the OnGraphDraw attribute to plot a solid fill between symmetry percentiles in a probability bands result view.

Plot solid prob bands (canv, info, roles, transparencyMask)
Fills in a solid band behind a probability bands view. To be used from the OnGraphDraw attribute. Usage:
- Set "Evaluate before drawing" AND "Evaluate after axes, before data"
- Set the OnGraphDraw expression to:
roleChanges := Plot_solid_prob_band( canv, info, roles )
- Select the bands view for your result.
- Make sure you have Color=.Probability for the pivot.
The function uses the lower percentile color (for example, for the 5- to 95-percentile fill, it uses the color for the 5-percentile, with the transparencyMask applied. The transparency mask in an integer between 0 and 255, where 0 (or null) is fully opaque, and 255 is full transparency (invisible). The default is a «transparencyMask» of 128. Because transparency blends the colors with the white background and with the solid bands behind a given band, the actual colors match the colors of the key exactly only when a «transparencyMask» of 0 is used. However, without transparency, the underlying grid no longer visible.
Library
To use this function ,you must add the OnGraphDraw annotations.ana library to your model.
- Use File → Add Library... to add this library.
Enable comment auto-refresher