Plot solid band
New to Analytica 5.2
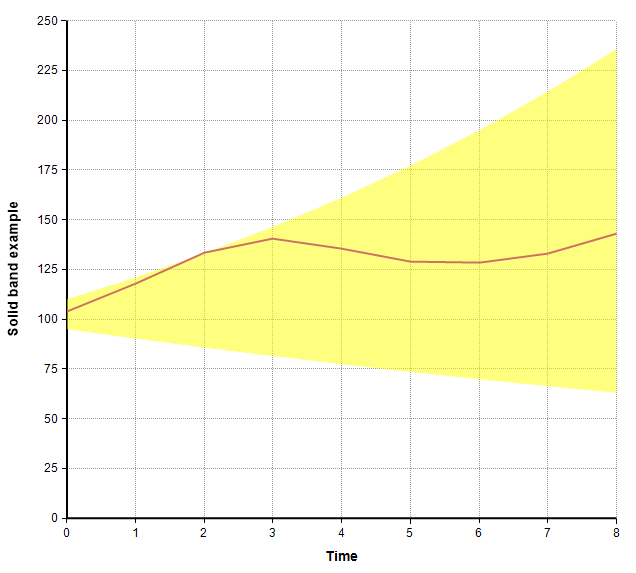
Use this function in the OnGraphDraw expression to plot a solid band behind your data, that highlights a range between lower and upper bounds that you explicitly specify.

Plot_solid_band(canv, info, roles, x, lowerY, upperY, color)
Plots a solid band between a «lower» and «upper» curve in the given «color» behind the data from an OnGraphDraw attribute expression. To use, enable both "Evaluate before drawing" and "Evaluate after axes, before data". In your call, you should do an IF on the view mode of interest, for example:
- If info[ OnGraphDrawItem='ViewMode']='Sample' Then
- roleChanges := Plot_solid_band( canv, info, roles, x, lowerY, upperY, x, 'LightGreen' )
Library
To use this function ,you must add the OnGraphDraw annotations.ana library to your model.
- Use File → Add Library... to add this library.
See Also
Comments
Enable comment auto-refresher