Difference between revisions of "Result menu"
(Exceedance probability.) |
|||
| (7 intermediate revisions by 2 users not shown) | |||
| Line 4: | Line 4: | ||
<breadcrumbs>Analytica User Guide > Menus > {{PAGENAME}}</breadcrumbs> | <breadcrumbs>Analytica User Guide > Menus > {{PAGENAME}}</breadcrumbs> | ||
| + | The [[Result menu]] allows to view result tables and graphs, and to configure how deterministic and non-deterministic (uncertain) values are displayed there. | ||
| + | |||
| + | The functionalities of the individual items of the [[Result menu]] are explained in the table below. | ||
:{| class="wikitable" | :{| class="wikitable" | ||
| − | | rowspan="43" | [[ | + | | rowspan="43" | [[Image:Result menu.png]] |
| − | ! style="width: | + | ! style="width: 160px;" | Menu item |
! Description | ! Description | ||
|- | |- | ||
|Show Result | |Show Result | ||
| − | |Opens a Result window for the selected object. See | + | |Opens a Result window for the selected object. See [[Result window]]. |
|- | |- | ||
|Mid Value | |Mid Value | ||
| − | |Displays the mid or deterministic value. See | + | |Displays the mid or deterministic value. See [[Uncertainty view of a result]]. |
|- | |- | ||
|Mean Value | |Mean Value | ||
| − | |Displays the mean of the uncertain value. See | + | |Displays the mean of the uncertain value. See [[Uncertainty view of a result]]. |
| − | |||
| − | |||
|- | |- | ||
|Statistics | |Statistics | ||
| − | |Displays statistics of the uncertain value in a table as set in the | + | |Displays statistics of the uncertain value in a table as set in the Uncertainty Setup dialog. See [[Uncertainty view of a result]]. |
| − | |||
| − | Uncertainty Setup dialog. See | ||
|- | |- | ||
|Probability Bands | |Probability Bands | ||
| − | |Shows probability bands (percentiles) as set in the Uncertainty | + | |Shows probability bands (percentiles) as set in the Uncertainty Setup dialog. See [[Uncertainty view of a result]]. |
| − | + | |- | |
| − | + | |Probability Density | |
| + | |Displays a probability density graph for an uncertain value. For a discrete probability distribution, Probability Mass replaces this command. See [[Uncertainty view of a result]]. | ||
|- | |- | ||
| − | |Probability | + | |Cumulative Probability |
| − | + | |Displays a cumulative probability graph representing the probability that a variable’s value is less than or equal to each possible (uncertain) value. See [[Uncertainty view of a result]]. | |
| − | |||
| − | |Displays a probability | ||
| − | |||
| − | a | ||
| − | |||
| − | |||
|- | |- | ||
| − | | | + | |Exceedance Probability |
| − | + | |Displays an exceedance probability graph representing the probability that a variable’s value is greater than or equal to each possible (uncertain) value. See [[Uncertainty view of a result]]. This option only appears in [[Analytica 5.4]] or after. | |
| − | Probability | ||
| − | |Displays | ||
| − | |||
| − | probability that a variable’s value is | ||
| − | |||
| − | possible (uncertain) value. See | ||
|- | |- | ||
|Sample | |Sample | ||
| − | |Displays a table of the values determined for each uncertainty | + | |Displays a table of the values determined for each uncertainty sample iteration. See [[Uncertainty view of a result]]. |
| − | |||
| − | sample iteration. See | ||
|- | |- | ||
|Graph Setup | |Graph Setup | ||
| − | |Displays a dialog to specify the graphing tool, graph frame, and | + | |Displays a dialog to specify the graphing tool, graph frame, and graph style. See [[Graphing roles]]. |
| − | |||
| − | graph style. See | ||
|- | |- | ||
|Number Format | |Number Format | ||
| − | |Displays a dialog to set the number format for displays of | + | |Displays a dialog to set the number format for displays of results. See [[Number formats]]. |
| − | + | |- | |
| − | + | | Cell Format... | |
| + | | (''New to [[Analytica 5.0]]''). Displays a dialog to change the cell-level appearance or behavior of table cells, including cell colors, borders, fonts, alignment, entry type and number formats. | ||
|- | |- | ||
| − | |Uncertainty | + | |Uncertainty Options |
| − | + | |Displays a dialog to specify the uncertainty sample size and sampling method and to set options for statistics, probability bands, probability density, and cumulative probability. See [[Uncertainty Setup dialog]]. | |
| − | Options | + | |} |
| − | |Displays a dialog to specify the uncertainty sample size and | ||
| − | |||
| − | sampling method and to set options for statistics, probability | ||
| − | + | ==See Also== | |
| + | * [[Menus]] | ||
| + | * [[Result window]] | ||
| + | * [[Result Tables and Graphs]] | ||
| + | * [[Number and table formats]] | ||
| + | * [[Graphs]] | ||
| + | * [[Uncertainty view of a result]] | ||
| + | * [[Expressing Uncertainty]] | ||
| − | + | <footer>Definition menu / {{PAGENAME}} / Diagram menu</footer> | |
| − | |||
Latest revision as of 22:58, 8 January 2020
The Result menu allows to view result tables and graphs, and to configure how deterministic and non-deterministic (uncertain) values are displayed there.
The functionalities of the individual items of the Result menu are explained in the table below.
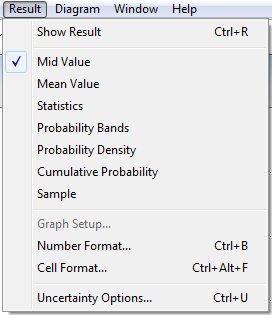
Menu item Description Show Result Opens a Result window for the selected object. See Result window. Mid Value Displays the mid or deterministic value. See Uncertainty view of a result. Mean Value Displays the mean of the uncertain value. See Uncertainty view of a result. Statistics Displays statistics of the uncertain value in a table as set in the Uncertainty Setup dialog. See Uncertainty view of a result. Probability Bands Shows probability bands (percentiles) as set in the Uncertainty Setup dialog. See Uncertainty view of a result. Probability Density Displays a probability density graph for an uncertain value. For a discrete probability distribution, Probability Mass replaces this command. See Uncertainty view of a result. Cumulative Probability Displays a cumulative probability graph representing the probability that a variable’s value is less than or equal to each possible (uncertain) value. See Uncertainty view of a result. Exceedance Probability Displays an exceedance probability graph representing the probability that a variable’s value is greater than or equal to each possible (uncertain) value. See Uncertainty view of a result. This option only appears in Analytica 5.4 or after. Sample Displays a table of the values determined for each uncertainty sample iteration. See Uncertainty view of a result. Graph Setup Displays a dialog to specify the graphing tool, graph frame, and graph style. See Graphing roles. Number Format Displays a dialog to set the number format for displays of results. See Number formats. Cell Format... (New to Analytica 5.0). Displays a dialog to change the cell-level appearance or behavior of table cells, including cell colors, borders, fonts, alignment, entry type and number formats. Uncertainty Options Displays a dialog to specify the uncertainty sample size and sampling method and to set options for statistics, probability bands, probability density, and cumulative probability. See Uncertainty Setup dialog.

See Also
Comments
Enable comment auto-refresher