Difference between revisions of "Category:OnGraphDraw annotations library functions"
(Created page with "''New to Analytica 5.2'' The '''''OnGraphDraw annotations''' library'' provides a collection of functions that you can use within the OnGraphDraw attribute of result...") |
m |
||
| Line 1: | Line 1: | ||
| − | '' | + | The '''''OnGraphDraw annotations''' library'' includes these functions to modify and annotate graphs, including: |
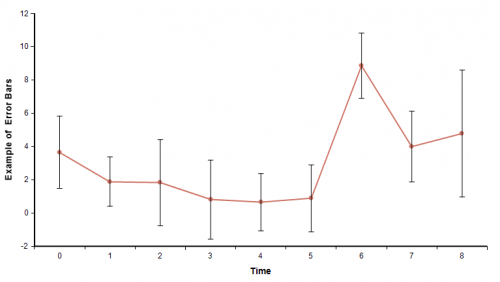
| − | + | * [[Plot_error_bars]] to show error bars around each plotted value | |
| + | [[image:Example_of_Error_Bars.png|500px]] | ||
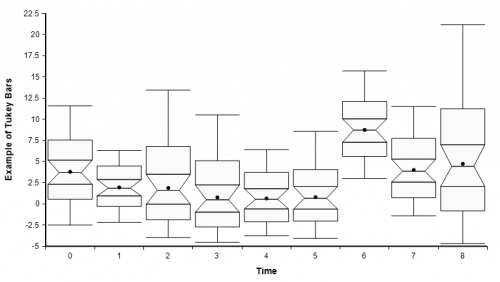
| − | + | * [[Plot_Tukey_bars]] to show distributions using Tukey bars | |
| + | [[image:Example_of_Tukey_bars.png|500px]] | ||
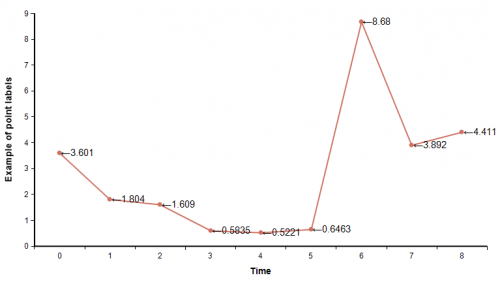
| − | + | * [[Plot_point_labels]] to add text labels to annotate selected points on a graph | |
| + | [[image:Example_of_point_labels.png|500pxpx]]' | ||
| + | |||
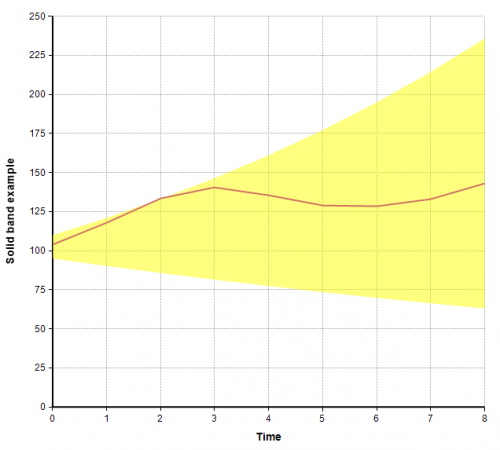
| + | * [[Plot_solid_band]] to fill in a solid band between graph lines | ||
| + | [[image:Solid band example.png|500px]] | ||
| + | |||
| + | * [[Plot_solid_prob_bands]] to fill in probability bands expressing uncertainty. | ||
| + | [[image:Solid_prob_band_example.png|500px]] | ||
| + | |||
| + | == Using this library == | ||
| + | |||
| + | To use this library, select '''''Add Library...''''' on the '''''File''''' menu, then select "<code>OnGraphDraw annotations.ana</code>". You can embed the library if you prefer, but we recommend you Link to the library so that you automatically get fixes and updates in subsequent releases. | ||
| + | |||
| + | To apply these functions to the graph of a variable, you must call them in its [[OnGraphDraw]] attribute with appropriate parameters. | ||
| + | |||
| + | == See Also == | ||
| + | |||
| + | * [[OnGraphDraw]] Attribute | ||
| + | * [[Plot_error_bars]] | ||
| + | * [[Plot_Tukey_bars]] | ||
| + | * [[Plot_point_labels]] | ||
| + | * [[Plot_solid_band]] | ||
| + | * [[Plot_solid_prob_bands]] | ||
| + | |||
| + | == History == | ||
| + | |||
| + | Released in [[Analytica 5.2]] | ||
Revision as of 22:49, 4 December 2019
The OnGraphDraw annotations library includes these functions to modify and annotate graphs, including:
- Plot_error_bars to show error bars around each plotted value
- Plot_Tukey_bars to show distributions using Tukey bars
- Plot_point_labels to add text labels to annotate selected points on a graph
- Plot_solid_band to fill in a solid band between graph lines
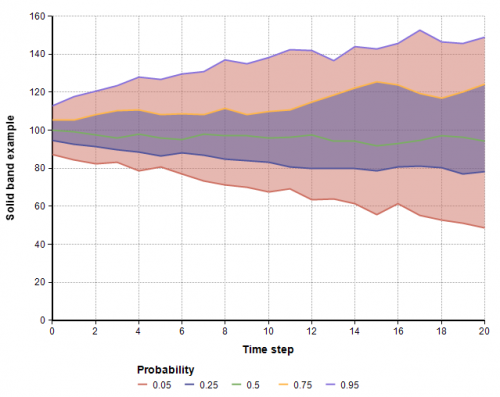
- Plot_solid_prob_bands to fill in probability bands expressing uncertainty.
Using this library
To use this library, select Add Library... on the File menu, then select "OnGraphDraw annotations.ana". You can embed the library if you prefer, but we recommend you Link to the library so that you automatically get fixes and updates in subsequent releases.
To apply these functions to the graph of a variable, you must call them in its OnGraphDraw attribute with appropriate parameters.
See Also
- OnGraphDraw Attribute
- Plot_error_bars
- Plot_Tukey_bars
- Plot_point_labels
- Plot_solid_band
- Plot_solid_prob_bands
History
Released in Analytica 5.2
Pages in category "OnGraphDraw annotations library functions"
The following 9 pages are in this category, out of 9 total.
