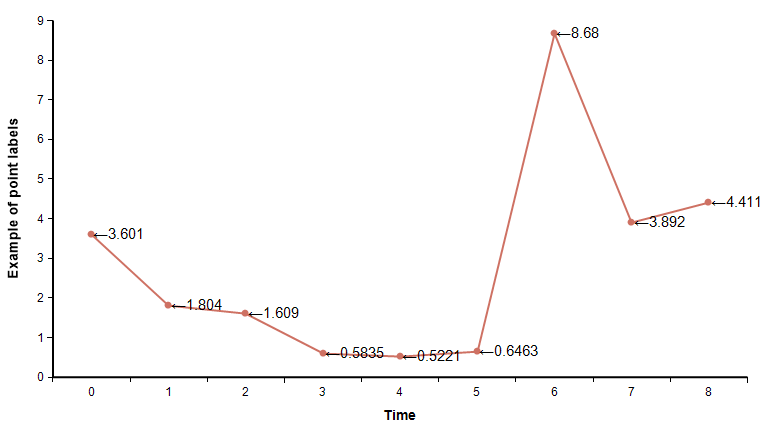
Plot point labels
New to Analytica 5.2
Use this function from the OnGraphDraw attribute to draw labels on each of your data points in the graph.

Plot_point_labels(canv, info, roles, labels, hAlign, vAlign)
This graph annotations function draws labels on points in a graph. Use this from the OnGraphDraw function.
To use this function:
- Set OnGraphDraw to evaluate after fully drawn.
- In your OnGraphDraw, decide on what labels you want to appear at each point.
- In your OnGraphDraw expression, call:
Plot_point_labels( canv, info, roles, labels )
- where «labels» specifies the labels text. If labels contains a number, it will be formatted according to the number format for your variable.
- Set the number format for your calling variable if you are passing in non-text for labels.
Library
To use this function ,you must add the OnGraphDraw annotations.ana library to your model.
- Use File → Add Library... to add this library.
Specifying labels
You can specify the «labels» in either of two ways.
- Method 1
- Specify a pattern. In this case, labels in a single atomic text containing the literal text that you want in the label, along with role substitutions. For example, "(<X axis>, <Y axis>)" will show the values for the X-axis and Y-axis roles in parens. The possible substitutions are the names in the GraphingRole index. If you specify a graphing role that is not present (set to blank), the corresponding substitution used will be the empty text.
- Example usage: Show the Y-axis value on each point:
Plot_point_labels(canv, info, roles, "<Y axis>" )
this will draw both X and Y values in parentheses:
Plot_point_labels(canv, info, roles, "(<X axis>,<Y axis>>" )
- Method 2
- Provide an array of values. Here you can compute your own labels. When using this method, you can use Self (which is the Sample value of Mid value, depending on context). Be aware that when you use the value of other variables, you may need to use the corresponding view-mode function. For example, in Mean view mode, use Mean(B), not just B.
- Example usage: Show the Y-axis value on each point:
- Local label := #roles[ GraphingRole='Y axis', GraphFillerInfo='Value' ];
- Plot_point_labels(canv, info, roles, label )
See Also
Comments
Enable comment auto-refresher