Plot error bars
New to Analytica 5.2
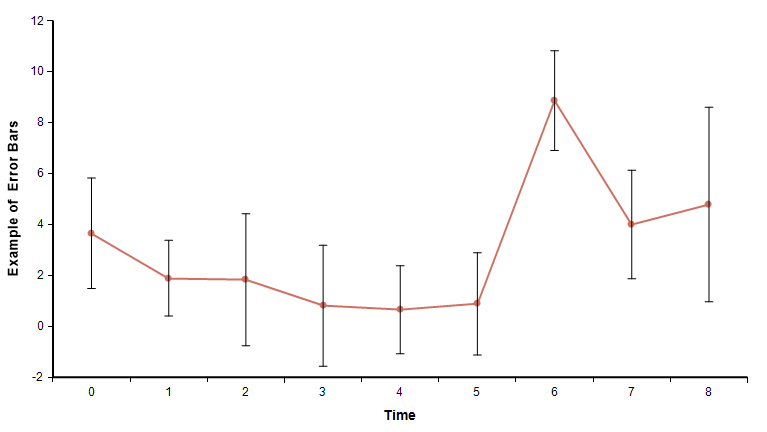
Use this function in the OnGraphDraw attribute to plot error bars around data points. Error bars are vertical lines that extend above and below a data point to visually indicate a range of uncertainty. The annotation is usually applied to a line-symbol chart where only one line is present, or less commonly to a vanilla bar chart.

Plot_error_bars( canv, info, roles, spread )
To use, in the OnGraphDraw attribute:
- From the Attributes dialog, turn on "Evaluate before drawing" AND "Evaluate after fully drawn".
- Calculate a spread for your variable. A common choice is:
SDeviation(Self). - Set the OnGraphDraw expression
- If info[ OnGraphDrawItem='ViewMode']='Mean' Then
- roleChanges := Plot_error_bars(canv, info, roles, phase, spread:SDeviation(Self));
- Note: You can substitute your own spread expression.
- Note: Error bars with
spread:SDeviation(Self) are usually appropriate only from the Mean result view.
The annotation works with a linear or log-scaled continuous Y-axis showing the variable's mean value. It also works with Swap XY (in which case the error bars are horizontal).
See Also
Comments
Enable comment auto-refresher