CanvasContext
New in Analytica 5.0
CanvasContext( canvas, clip, rotAngle, rotx, roty, shiftx, shifty, scalex, scaley )
Returns a drawing context with a new clip region or coordinate system. The result can be passed to the «canvas» parameter of any of the Canvas functions.
The clip or coordinate system of the original canvas or context is not changed, and you can continue to draw to the original canvas or coordinate system or to the new canvas.
Parameters
- «canvas» is a canvas obtained from calling the
Canvas()function, or a canvas context obtained by calling theCanvasContext()function. - «clip»: (Optional) When specified, four numbers must be provided: x1, y1, x2, y2. See #Clipping below.
- «rotAngle», «rotx», «roty»: (Optional) Specifies the rotation. See #Rotations below.
- «shiftx», «shifty»: (Optional) Specifies a translation for the context's coordinate system relative to the original coordinate system. See #Shifting below.
- «scalex», «scaley»: (Optional) Specifies a scaling for the context's coordinate system -- how many of the original context's units correspond to one unit in the new coordinate system. See #Scaling below.
When multiple context changes are specified in one call, they are applied in this order: Rotation, translation, scaling then clipping. See #Order of context changes below.
Clipping
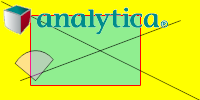
Clipping limits the area where stuff that you draw shows up. You specify a clipping rectangle using the «clip» parameter. To illustrate, let's first consider an example with several items drawn without any clipping.
Var canv := Canvas( 200, 100, 'Yellow' );
CanvasDrawRectangle( canv, 30, 15, 110, 70, fillColor:'lightgreen', lineColor:'Red' );
CanvasDrawLine(canv, 20, 80, 180, 20 );
CanvasDrawLine(canv,1,1,200,100);
CanvasDrawEllipse(canv,10,50,50,60,fillColor:0x40FF33FF,sweepAngle:-90,pie:true,startAngle:-50,lineColor:'Black',lineWidth:0.5);
CanvasDrawImage( canv, pict of Analytica_Logo );
CanvasImage(canv )
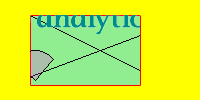
We'll leave the rectangle as is so we have a visual indication of where our clipping rectangle is, but the other items are now drawn to a new context with a clipping region with the same dimensions as the rectangle. Changes are highlighted.
Var canv := Canvas( 200, 100, 'Yellow' );
Var cxt := CanvasContext(canv, clip:[30,15,110,70]);
CanvasDrawRectangle( canv, 30, 15, 110, 70, fillColor:'lightgreen', lineColor:'Red' );
CanvasDrawLine(cxt, 20, 80, 180, 20 );
CanvasDrawLine(cxt,1,1,200,100);
CanvasDrawEllipse(cxt,10,50,50,60,fillColor:0x40FF33FF,sweepAngle:-90,pie:true,startAngle:-50,lineColor:'Black',lineWidth:0.5);
CanvasDrawImage( cxt, pict of Analytica_Logo );
CanvasImage(canv )


Enable comment auto-refresher