Drawing images
New in Analytica 5.0
Drawing images
The canvas functions are used to draw your own images, so called because the names of all the drawing functions start with Canvas. In an expression, you can draw lines, rectangles, ellipses, text, and other images to the canvas, and then once you've finished drawing, create an image from your canvas that can then be displayed, either in the cells of a result table, or on a diagram by assigning it to a Pict attribute (usually of a Picture node).
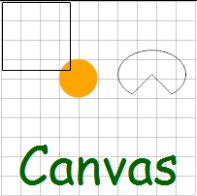
You create an image by creating a canvas using the Canvas() function, drawing to that canvas, and finally producing an image from the canvas using CanvasImage(). For example:
Local c := Canvas(201,201);

{ Some drawing }
LocalIndex n := Sequence(0,200,20);
CanvasDrawLine(c, n,0, n,200, dash:'Dot', color:'Gray' );
CanvasDrawLine(c, 0,n, 200,n, dash:'Dot', color:'Gray' );
CanvasDrawEllipse(c, 59,59,40,40,fillColor:'Orange');
CanvasDrawRectangle(c, 1,1,70,70);
CanvasDrawEllipse(c, 120,50,70,50, startAngle:135, sweepAngle:270, pie:true );
CanvasDrawText(c, 'Canvas', 100, 130, font:'Comic Sans MS', size:40, hAlign:'Center', color:'DarkGreen');

{ Create an image from the canvas }
CanvasImage( c )
The result is:
Context
A canvas context is used to create a clipping region or to alter the coordinate system by scaling, shifting, or rotating. A canvas context is obtained from the CanvasContext function. After obtaining a context, you can draw to the context as you would a canvas.
Local c0 := Canvas(120,120);
Local c := CanvasContext(c0, shiftx:70,shifty:70, scalex:1.5, scaley:150, rot:10,rotx:150,roty:50, clip:[-25,-0.25,50,0.5]);
CanvasDrawRectangle(c,-25,-0.25,50,0.5, lineWidth:2, dash:'Dot' );
CanvasDrawEllipse(c,-35,-0.15,70,0.3,fillColor:0x5022ccff,lineColor:'Red');
CanvasDrawEllipse(c,-15,-0.35,30,0.7, fillColor:0x50eecc11, lineColor:'Green');
CanvasImage(c0)
See Also
- Drawing images examples.ana -- A model with the examples shown above.
- Video Short: An expression to crop an image
- Canvas
- CanvasImage
- CanvasContext
- CanvasDrawImage, CanvasDrawLine, CanvasDrawEllipse, CanvasDrawRectangle, CanvasDrawText, CanvasDrawPolygon
- ImageInfo
- ReadImageFile, ReadFromURL
- Color parameters


Enable comment auto-refresher