Diagram window
| Release: |
|---|
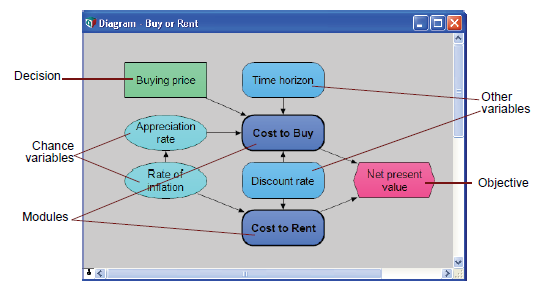
When you open a model, it shows a Diagram window. This window usually shows an influence diagram, like this.
Each node depicts a variable (thin outline) or module (thick outline). The node shape and color tells you its class — decision, chance, objective, module, and so on. The arrows in a Diagram window depict the influences between variables. An influence arrow from variable A to variable B, means that the value of A influences B, because A is in the definition of B. So, when the value of A changes, it can change the value (or probability distribution) for B.
In the diagram above, the arrow from Buying price to Cost to buy means that the price of the house affects the overall cost of purchasing it. The influence diagram shows the essential qualitative structure of the model, unobscured by details of the numbers or mathematical formulas that can underlie that structure. For more on using influence diagrams to build clear models, see Creating Lucid Influence Diagrams.
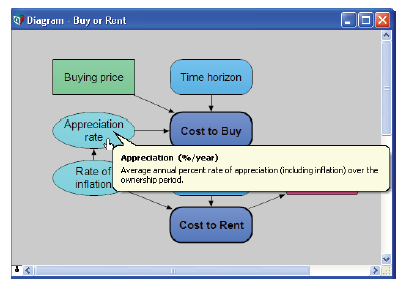
Balloon Help: Node titles are typically kept terse to promote quick visual interpretation of influence relationships, but because they are terse, you may be left with questions about what they mean or represent. For example, Appreciation rate refers to the appreciation of what? Over what time period? Is it inflation adjusted? What units are used? What is the underlying identifier for that node that is used in definition expressions? What is the source for this estimate?
The author of the model can address these types of questions with a more detailed Description for each variable or module. While you are viewing an influence diagram in browse mode, hover your mouse cursor over a node for about one second and a help balloon appears for nodes that have help text or a description.
To view results: To view the value of a variable, first click its node to select it. Then click the Result button ![]() in the navigation toolbar to open a Result window showing its value as a table or graph. Result Tables and Graphs tells you more.
in the navigation toolbar to open a Result window showing its value as a table or graph. Result Tables and Graphs tells you more.
Opening details from a diagram: To see more details of a model, double-click nodes in the Diagram window:
- Double-click a variable node (thin outline) to open its Object window.
- Double-click a module node to (thick outline) see its Diagram window, showing the next level of detail of the model.
Going to the parent diagram: To see the diagram that contains the active module or variable, click the Parent Diagram button ![]() in the navigation toolbar. The module or variable is highlighted in the parent diagram.
in the navigation toolbar. The module or variable is highlighted in the parent diagram.
Seeing remote inputs and outputs
When a variable has a Remote input — that is, it depends on a variable in another module — a small arrowhead appears to the left of its node. Similarly, if it has a remote output, a small arrow-head appears to its right. Press on the arrowhead to quickly view and navigate influences between nodes in different diagrams (modules).
To see a list of the inputs (or outputs), remote and local, press the arrowhead on the left (or right) of the node.
To jump to a remote input or output, select it from the list and stop pressing. It opens the Diagram window containing the remote variable, and highlights its node.
See Also
- Diagram menu
- Tutorial: Becoming familiar with the Diagram window
- Diagram Style dialog
- Graphics, frames, and text in a diagram
- Creating Lucid Influence Diagrams
- Arranging nodes to make clear diagrams
- Node Style dialog
- Node Alignment, Sizing, and Spacing
- User input nodes and user output nodes
- Object window
- Result window
- Result Tables and Graphs
- Hover icons
- Help balloons


Enable comment auto-refresher