OnGraphDraw
This attribute lets you annotate a graph with text, lines, areas, and other graphics -- for example, to add labels to points, or point out interesting aspects of a graph. It even lets you show a map or other image under a graph, and display points over it. The annotations may depend on the values being graphed and so reposition themselves as the data changes.
This feature is experimental and may be subject to future non-backward-compatible changes. Requires Analytica 5.1 or later.
Attribute OnGraphDraw
You can specify an expression in the OngraphDraw attribute, which is evaluated while a graph is being drawn. The expression uses Drawing commands on a Canvas, which lies under or over the standard graph plot .
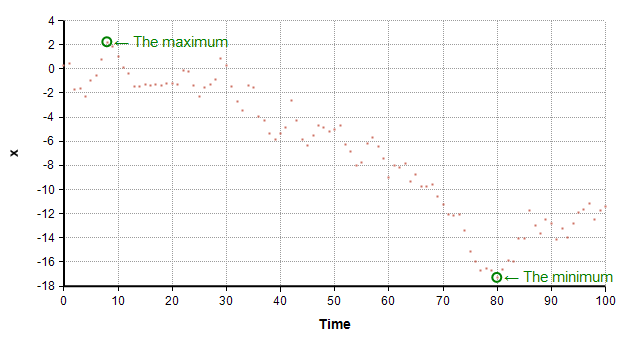
This examples finds and labels, the minimum and maximum points in a data series:
The graphing engine scaled and drew the axes and plotted the points. The code in the OnGraphDraw attribute found the min and max points and drew the annotations.
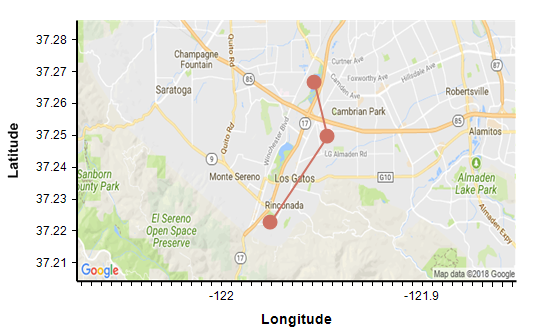
In this example, OnGraphDraw gets a map from Google maps and draws it behind the plotted data. Here the X-Y graph has three data points connected by two lines:
The OnGraphDraw expression obtains the map from Google maps using ReadFromURL -- the map is not served by the graphing engine itself.
Locals
These local variables are accessible within an OnGraphDraw expression, and give information about the graph and the current graphing roles:
- canv: The canvas
- info: A vector of information about the graph, such as the dimensions of the graph and location of the plot area. The vector is indexed by the system index OnGraphDrawItem index.
- phase: The drawing phase. This enables you to detect at what stage of the graph rendering the attribute is being evaluated. Possible values are: 1=Before graphing has started, 2=After the graph layout has been calculated, but before anything is drawn, 4=After the background and axes have been drawn, but before the data is plotted, 8=After the graph has been fully rendered (except for your own embellishments).
- roles: Information about the graphing dimensions that fill each graphing role. This is indexed by GraphingRoles and GraphFillerInfo.
- continue: A boolean that you can set to false if you don't want the graph to be drawn any further beyond this point. This can be used to substitute your own custom drawing code in place of the built-in graphing engine, which might include totally different graphical depictions.
- roleChanges: It is possible to alter axis scaling by changing items in this local. For example, you may need to adjust the axis range in order to register a map image so that data plotted on top appear at the correct latitude and longitude.
When OnGraphDraw is evaluated
The OnGraphDraw attribute can be called at four different points during the graph rendering. By default, it is called only after the graph has been rendered. That is a useful point if you want to draw annotations on the graph over the data. To cause it to evaluated at other points during the graph rendering processes, set the system variable OnGraphDrawFlags to a number equal to the sum of any of these flags:
- 1 = Call before graphing has started. (Note: The layout info, such as the plot area, is not yet determined).
- 2 = Call after the layout has been determined, but before the grapher has drawn anything.
- 4 = Call after the background and axes have been drawn, but before data points, lines or bars have been drawn.
- 8 = (default) Call after the standard graphing has completed.
To replace a graph entirely with a custom graphical depiction of your own, set OnGraphDrawFlags to 1, and then set continue:=0 from your OnGraphDraw code.
To draw an image behind everything else, or alter the exact axis scaling, set OnGraphDrawFlags=2 flag. For example, this is a good time to draw a map and then twiddle the axis ranges to ensure proper map registration.
To draw in front the background, but behind the data, set OnGraphDrawFlags=4.
To annotate the graph or data with images in front of the data, set OnGraphDrawFlags=8.
You may do more than one of the above things by including an If-Then branch on the local phase in the OnGraphDraw expression.
To access OnGraphDraw
The OnGraphDraw Attribute is currently an experimental feature. To make it visible, press F12 to open the Typescript Window, and then type: AskAttribute OnGraphDraw, Variable, yes
It will now appear in the Attribute panel and Object window, where you can give it an Analytica expression.
Basics of drawing
To draw on the graph surface, use the Canvas drawing functions to draw to canv where canv is the name of a local variable available to you in the OnGraphDraw attribute. For example:
- OnGraphDraw:
CanvasDrawRectangle( canv, x:100, y:130, width:80, height:50, fillColor:0x440000ff )
This rectangle always appears at the same location, and doesn't adapt when the graph window is resized; therefore, its location does not necessarily coincide with any particular data, unless by chance. The difficult part is writing code that figures out where to draw. The plot area in canvas pixel coordinates is provided in the local variable named info as illustrated here:
OnGraphDraw:
CanvasDrawEllipse(canv,
x:info[OnGraphDrawItem='PlotAreaLeft'],


y:info[OnGraphDrawItem='PlotAreaTop'],


width: info[OnGraphDrawItem='PlotAreaWidth'],


height: info[OnGraphDrawItem='PlotAreaHeight'],


fillColor:0x440000ff )
The y-axis scale goes from roles[GraphingRole='Y axis', GraphFillerInfo='Min'] to roles[GraphingRole='Y axis', GraphFillerInfo='Max']. So to annotate a threshold at y=1000, you could use this OnGraphDraw expression
Local yThresh := 1000;
Local yAxis := roles[GraphingRole='Y axis'];
Local yMin := yAxis[GraphFillerInfo='Min'];
Local yMax := yAxis[GraphFillerInfo='Max'];
Local y0 := info[OnGraphDrawItem='PlotAreaTop'];
Local h := info[OnGraphDrawItem='PlotAreaHeight'];
Local y := (yMax-yThresh)/(yMax-yMin) * h + y0;
Local x1 := info[OnGraphDrawItem='PlotAreaLeft'];
Local x2 := info[OnGraphDrawItem='PlotAreaWidth'] + x1;

CanvasDrawLine( canv, x1,y, x2,y, color:'Green', width:3);
CanvasDrawText(canv,"Threshold", x1,y,color:'Green',vAlign:'Bottom')
To do
This page is under construction. Additional content would show
- Replacing the graph with a custom display. For example, pie or classification tree. This uses
OnGraphDrawFlags:=1 - Adjusting the axis scales to register map coordinates. This sets
roleChangesduringphase=2. - Document the full set of items in the OnGraphDrawItem index.
- Document the full set of graphing roles, and the GraphFillerInfo for each.


Enable comment auto-refresher