File list
This special page shows all uploaded files.
| Date | Name | Thumbnail | Size | User | Description | Versions |
|---|---|---|---|---|---|---|
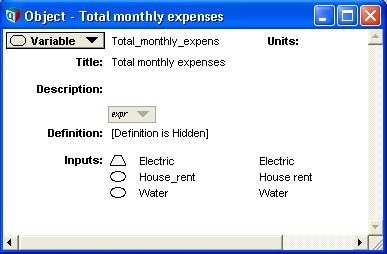
| 08:24, 11 June 2008 | Unhide definition1.jpg (file) |  |
20 KB | ReneeB | 2 | |
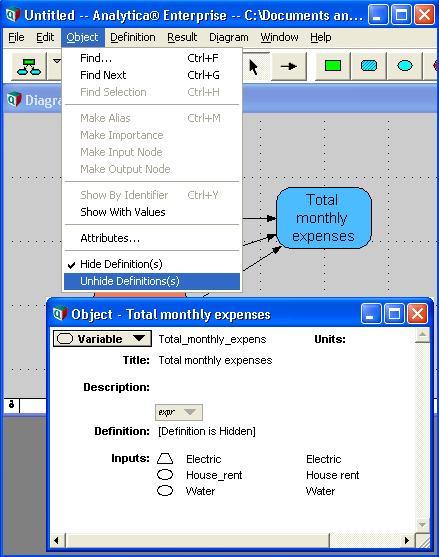
| 08:23, 11 June 2008 | Unhide definition.jpg (file) |  |
51 KB | ReneeB | 2 | |
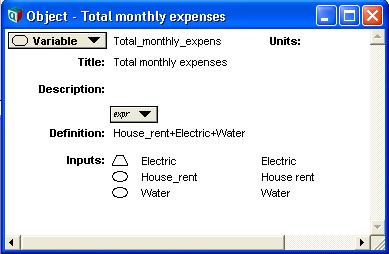
| 08:14, 11 June 2008 | Hide definition1.jpg (file) |  |
19 KB | ReneeB | 2 | |
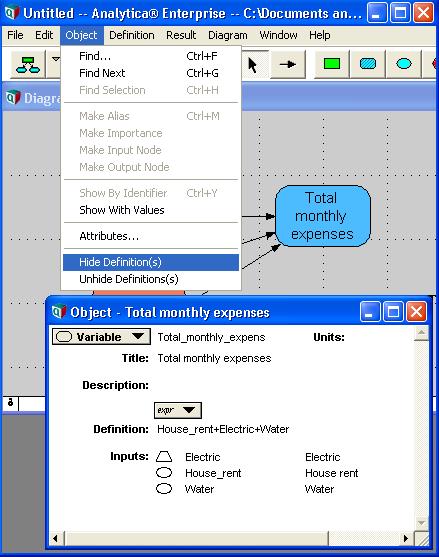
| 08:14, 11 June 2008 | Hide definition.jpg (file) |  |
53 KB | ReneeB | 2 | |
| 07:45, 3 June 2008 | Right click graph menu.PNG (file) |  |
17 KB | ReneeB | 1 | |
| 18:33, 29 May 2008 | Building Control Panels.ana (file) | 520 KB | Lchrisman | From user group webinar on this topic 29 May 2008 | 1 | |
| 07:50, 29 May 2008 | Background.PNG (file) |  |
13 KB | ReneeB | 1 | |
| 07:32, 29 May 2008 | Text bold.PNG (file) |  |
12 KB | ReneeB | 1 | |
| 07:01, 29 May 2008 | Axis Ranges2.PNG (file) |  |
13 KB | ReneeB | 1 | |
| 07:01, 29 May 2008 | Axis Ranges1.PNG (file) |  |
14 KB | ReneeB | 1 | |
| 06:50, 29 May 2008 | Histogram.PNG (file) |  |
14 KB | ReneeB | 1 | |
| 06:42, 29 May 2008 | Statistics graph.PNG (file) |  |
14 KB | ReneeB | 1 | |
| 06:13, 29 May 2008 | Stati.PNG (file) |  |
12 KB | ReneeB | 1 | |
| 12:06, 28 May 2008 | PostCompression.ana (file) | 7 KB | Sswamy | 1 | ||
| 11:02, 28 May 2008 | Mnth2qtr.zip (file) | 2 KB | Sswamy | 1 | ||
| 10:59, 28 May 2008 | Items within budget.ana (file) | 3 KB | Sswamy | 1 | ||
| 10:41, 28 May 2008 | Feasible Sampler.ana (file) | 5 KB | Sswamy | Models that illustrates sampling from only feasible points | 1 | |
| 10:33, 28 May 2008 | Convolution (file) | 4 KB | Sswamy | 1 | ||
| 10:26, 28 May 2008 | Convolution.ana (file) | 4 KB | Sswamy | 1 | ||
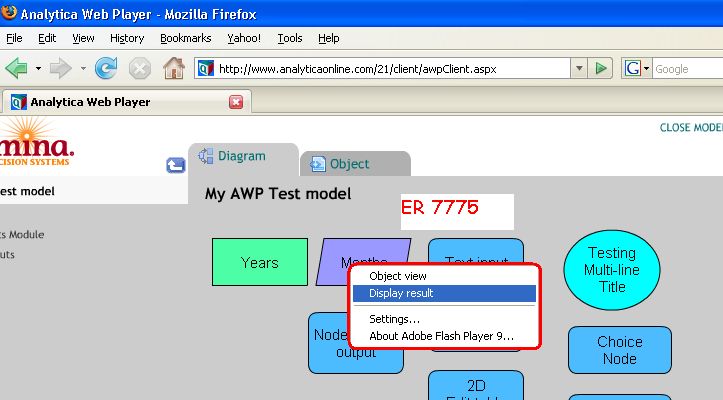
| 06:11, 24 May 2008 | ER 7775.PNG (file) |  |
42 KB | ReneeB | 1 | |
| 19:44, 22 May 2008 | Statistical Functions.ANA (file) | 59 KB | Lchrisman | User group webinar model | 1 | |
| 17:48, 15 May 2008 | UG Webinar Scatter Plots.ana (file) | 17 KB | Lchrisman | Examples of using graphing roles to display data in the form of scatter plots. | 1 | |
| 18:51, 1 May 2008 | Using Regression.ANA (file) | 47 KB | Lchrisman | Model developed during the 1 May 2008 webinar | 1 | |
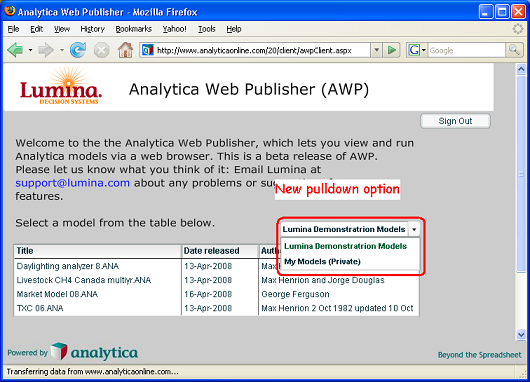
| 02:31, 26 April 2008 | New pulldown menu.PNG (file) |  |
104 KB | ReneeB | 1 | |
| 19:36, 24 April 2008 | Functions for Reading Excel Worksheets.ana (file) | 7 KB | Lchrisman | 2 | ||
| 17:58, 24 April 2008 | SOLVSAMP.XLS (file) | 135 KB | Lchrisman | Slightly modified (some range names defined) version of the example that comes with office. Result of the webinar on 24 Apr 2008 | 1 | |
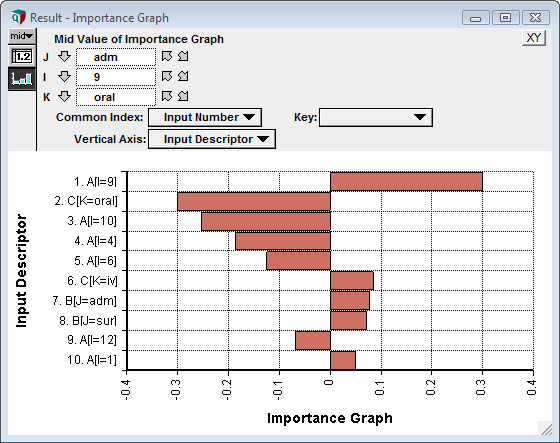
| 03:48, 18 April 2008 | Importance graph 10top.png (file) |  |
18 KB | Lchrisman | 1 | |
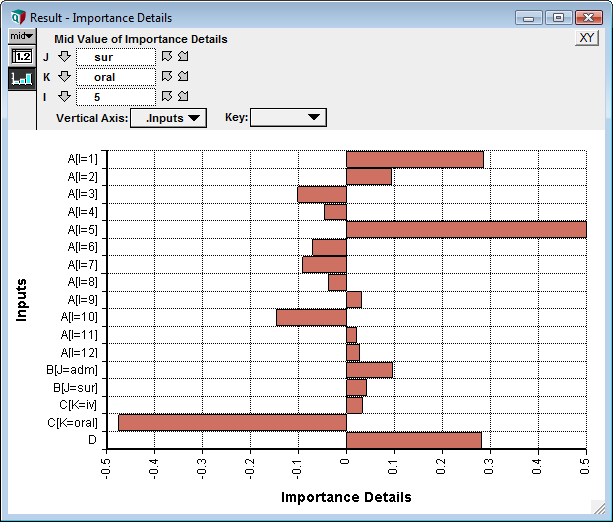
| 03:07, 18 April 2008 | Importance details window.png (file) |  |
20 KB | Lchrisman | 1 | |
| 02:46, 18 April 2008 | Importance graph 5top.png (file) |  |
8 KB | Lchrisman | 1 | |
| 23:56, 17 April 2008 | Sensitivity functions ex1.png (file) |  |
20 KB | Lchrisman | 2 | |
| 23:28, 17 April 2008 | Sensitivity Functions Examples.ana (file) | 8 KB | Lchrisman | 1 | ||
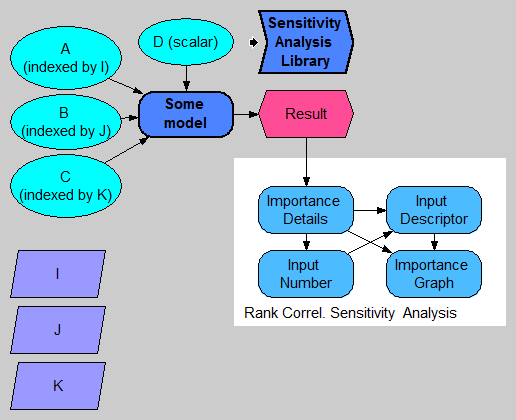
| 23:26, 17 April 2008 | Sensitivity Analysis Library.ana (file) | 14 KB | Lchrisman | 1 | ||
| 23:24, 17 April 2008 | Biotech R&D Portfolio Tornado.ana (file) | 33 KB | Lchrisman | 1 | ||
| 23:23, 17 April 2008 | Sales Effectiveness Model with tornado.ana (file) | 23 KB | Lchrisman | 1 | ||
| 16:52, 16 April 2008 | Regression comparison plot.png (file) |  |
19 KB | Lchrisman | 2 | |
| 16:51, 16 April 2008 | RegressionCompare.ana (file) | 4 KB | Lchrisman | 4 | ||
| 07:01, 11 April 2008 | WebSite6.rar (file) | 9 KB | Fredbrunt | This is the Visual Studio solution which goes along with the webinar about ADE presented by Fred (me) on April 10, 2008 | 1 | |
| 22:11, 24 March 2008 | ReadURL.exe (file) | 34 KB | Lchrisman | This re-upload fixes two problems. It is a release build, removing the need for VC++ debug libraries on the target computer, and it handles a URL that doesn't begin with "http://" without crashing. | 3 | |
| 18:51, 20 March 2008 | Tornado Charts.ANA (file) | 36 KB | Lchrisman | User group webinar of 3-20-2008 on Tornado Charts | 1 | |
| 19:54, 18 March 2008 | Base Conversion Library.ana (file) | 10 KB | Lchrisman | A library for converting between binary, octal, decimal and hexidecimal representations of numbers | 2 | |
| 19:16, 13 March 2008 | Tornado plot.png (file) |  |
8 KB | Lchrisman | 1 | |
| 18:08, 13 March 2008 | Correlated distributions.ana (file) | 39 KB | Lchrisman | User group webinar on specifying correlated distributions | 1 | |
| 19:30, 6 March 2008 | Assessment of distributions.ppt (file) | 154 KB | Lchrisman | Power point slides from the webinar of 6-Mar-2008. | 1 | |
| 01:19, 6 March 2008 | Probability assessment.ana (file) | 36 KB | Lchrisman | Game used during the probability assessment webinar on 5 Mar 2008 | 1 | |
| 18:57, 28 February 2008 | Graph style templates.ana (file) | 36 KB | Lchrisman | 1 | ||
| 00:00, 23 February 2008 | Embedded-shared-slicer.jpg (file) |  |
48 KB | Lchrisman | 1 | |
| 23:56, 22 February 2008 | Embedded-multi-slices.jpg (file) |  |
39 KB | Lchrisman | 1 | |
| 23:09, 22 February 2008 | Embedded-multiple-views.jpg (file) |  |
46 KB | Lchrisman | 1 | |
| 22:58, 22 February 2008 | Embedded-multiple-pivots.jpg (file) |  |
51 KB | Lchrisman | 1 | |
| 05:48, 20 February 2008 | New face.PNG (file) |  |
61 KB | ReneeB | 1 |