X-Y plots
You can compare the result of a variable against another variable, or one column against another column of a result, using an XY-plot. XY plots can be graphed for Mid, Mean, Statistics, Probability Bands, and Sample view modes.
To graph one variable against another:
- Open a Result window for the
y-(vertical axis) variable. - Click the XY button
 located in the top-right corner of the window to open the XY Comparison Sources dialog.
 - Check the Use another variable checkbox, press Add..., and in the Object Finder dialog, select the
x-(horizontal axis) variable.
The two variables in an XY window must share at least one index, and all indexes of x must also be indexes of y. The popup menu in the index selection area becomes Common Index — only indexes of both x and y might be selected.
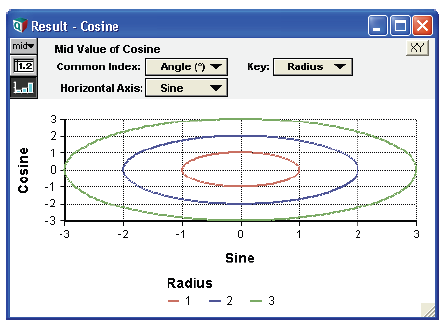
Variable Angle := Sequence(0, 360, 10)Variable Radius := 1 .. 3Variable SinX := Radius * Sin(Angle)Variable Cosine := Radius * Cos(Angle) →
Click the XY button, check Use another variable, then Add...., and in the Object Finder dialog under Current Module select the variable Sine to display this result.
Click the Table View button to display this result.
To return to the graph or table of Cosine vs. Degrees, click in the XY checkbox.
See Also


Enable comment auto-refresher