Example 2: Beer Distribution with Added Scenario
In this example, let’s assume that beer demand in the Western and Southern markets will depend on the winner of the 2015 World Series.
Model Description
Let's assume that people in the winning market will drink more, while those in the losing market will drink less.
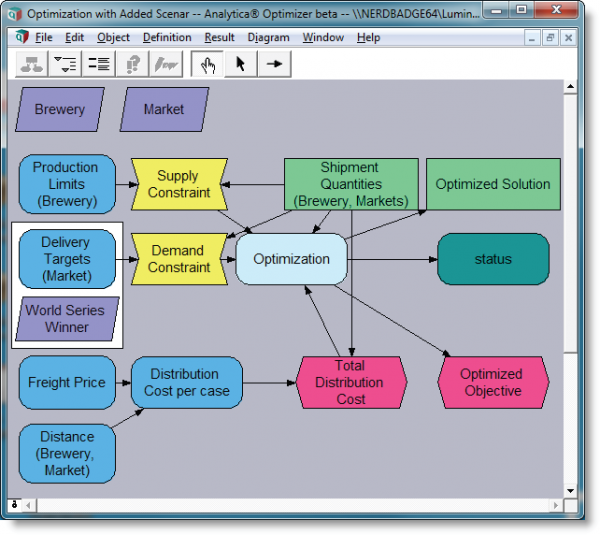
To show this in the model, we add a new index titled World Series Winner and add this new dimension to the Delivery Targets array. Then we edit the values in the array to reflect the new assumptions. No other adjustments are necessary.
Combining Optimization with Intelligent Arrays
Now that the model is clear on which indexes are intrinsic, you are free to add extrinsic indexes and rely on Analytica’s Intelligent Array abstraction features just as you would in any other situation. In this example we add a new dimension that propagates from optimization inputs all the way to the solution array, driving multiple optimization runs along the way. This demonstrates how easy it is to combine optimization with Analytica’s Intelligent Arrays.
Setting Up the Model
To explore and follow this example in Analytica, find the Beer Distribution LP 2.ana model in the Optimizer Examples folder. In this section we start with the model from Example 1, detailing changes only.
World Series Winner
Add a new index for the World Series Winner
Index World_Series_Winner := [‘Giants win World Series’, ‘Rangers win World Series’]
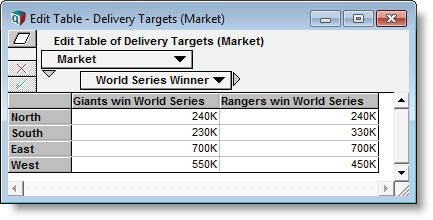
Edit Delivery Targets Array
To add this new index to the Delivery Targets array, open the edit table and press the Index selection button in the upper left corner. Add World Series Winner to the list of indexes for this array.
Edit the two-dimensional table to match the values shown here:
Variable Delivery_Targets := Table(Market,World_Series_Winner)
      (240K, 240K, 230K, 330K, 700K, 700K, 550K, 450K)
Verifying the Optimization Setup
Evaluate the Optimization node and check status
The DefineOptimization() function now evaluates to an array, telling you that the optimizer is performing independent optimizations for each World Series scenario.
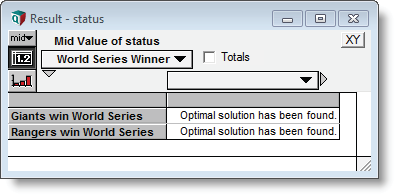
The status text reports the status of each optimization individually.
Checking the result
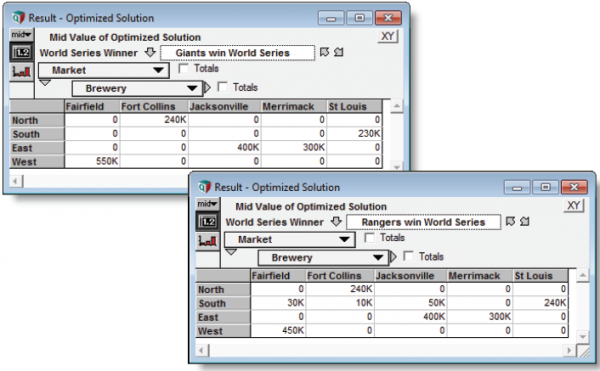
Evaluate the Optimized Solution array to check the solution.
The result is a three-dimensional array including both intrinsic and extrinsic dimensions. You can pivot the output to any desired configuration.
Summary: Beer Distribution LP with Added Scenario
In this example, we started with the basic model and added a new dimension to the Delivery Targets input array. According to the basic rules of array abstraction, Analytica adds the new dimension to all arrays influenced by Delivery Targets. These include Demand Constraint, Optimization, Optimized Solution, Optimized Objective and Status values. Adding an extrinsic dimension to the Optimization node drives separate optimization runs for each element of the extrinsic array.
The solution output combines intrinsic and extrinsic dimensions, representing them all in a combined array. In this example, the dimensions of the solution array are Brewery, Market, and World Series Winner.
See Also


Enable comment auto-refresher