ACP Diagram Sizes
Analytica Cloud Platform (ACP) uses a fixed size window within a web browser window. Usually, the ACP window is the size of the main model diagram in Analytica, with some extra space for the logo, title, and navigation tabs at the top -- and on the left if showing Outline or Tabs on the left. In Analytica you can resize any diagram window just by dragging its bottom right corner. So it's possible that the window of a submodule could be larger than the main model and so some of the window won't be immediately visible. Here are ways to deal with this:
- In Google Chrome, Microsoft Edge and Internet Explorer (but not Firefox or Safari) users can zoom out the view to see more of the diagram in Browser window. In these browsers, use keyboard shortcut Ctrl - or Ctrl + mouse scroll-wheel back to zoom out (and Ctrl+ or Ctrl + mouse scroll-wheel forward to zoom back in). On a Mac use ⌘- or ⌘+. Browsers also offer menu commands for zooming.
- But, it's much better for your end users if you design your ACP model interface windows to work well inside a browser using a minimum screen resolution so that they can see the whole interface without having to zoom or scroll. The next section explains how.
Set the ACP Diagram size
In Analytica, you can resize a diagram window simply by dragging its bottom right corner. But, how large should it be? It's best to make sure it will fit within a browser window on the smallest resolution screen your users are likely to use.
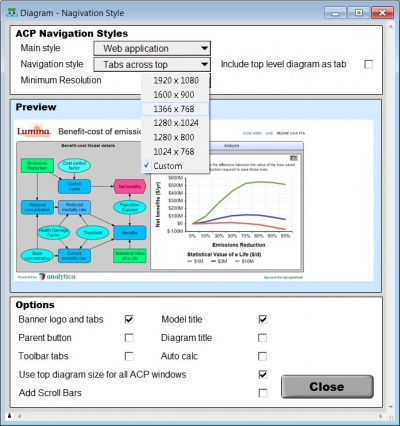
The easiest way is to use the ACP Style Library. (When you're designing a model for ACP, you should definitely include this standard library in your model.) Open the library in your model, and open the Navigation styles section. Select the window size from the Minimum Resolution choice menu:
When you make your selection it automatically resizes the main model window allowing space for tabs down the left or across the top if you have selected one of those options from the Navigation style menu. (Do that first before selecting the Minimum Resolution.)
The default "Custom" option allows you to manually size your top diagram window.
Maximum Recommended Diagram Sizes
These are the recommended diagram window sizes for common screen resolutions for ACP, assuming the end user has put their web browser in full-screen model.
Screen Resolution Tabs down the left Tabs across the top 1920 x 1080 1635 x 840 1905 x 810 1600 x 900 1315 x 660 1585 x 635 1366 x 768 1075 x 540 1350 x 505 1280 x 1024 990 x 785 1265 x 755 1280 x 800 990 x 555 1265 x 525 1024 x 768 735 x 520 1010 x 490
You should design to display resolution, which is not necessarily a screen's given resolution. Many browsers now use higher ppi (pixels per inch) so while their resolutions can be very large, their display resolutions will be much smaller. For example, Retina Macbooks have resolutions of 2560x1600 (13") and 2880x1800 (15"), but display at 1280x800 and 1440x900, respectively.
Note for Geeks on Diagstate
Analytica stores the diagram size in the DiagState attribute of the module. To see this, open Typescript (Ctrl + ') and type in command profile <module>. This displays a number of attributes of the module, including diagState: x, x, x, width, height, x. The diagState numbers include the Analytica window scroll bars shown below, but they are not part of the viewable area -- only parts of the model contained in the viewable area (in the image the lighter gray area containing the grid) will be displayed in ACP.
See Also
- ACP
- AcpStyles
- ACP Style Library
- W3Schools.com table of screen resolution statistics


Enable comment auto-refresher