CellBar
New to Analytica 5.0
CellBar( len, color, negColor, gradient, scaleToAllSlices, scaleToSpan )
Displays a bar in table cells, sort of like one bar from a bar chart. This can be used to graphically communicate information, usually about the quantity in that cell, but potentially information not shown in the cell. CellBar is used from the Cell Format Expression attribute is you own Computed cell formats logic.
When both positive and negative values exist, a vertical line depicts the position of zero, with negative bars going left, and positive bars going right.
Parameters
- «len»: The value that determines the length of the bar.
- «color»: (blue) The color of the bar, and as ARGB-integer color, or a textual color name. See CellFill for details on ARGB-integers and color names. This is used for both positive and negative values when specified when «negColor» is not specified.
- «negColor»: (red) The color used for negative values.
- «gradient»: (true) When true, the bar is drawn with a gradient color, when false a solid color.
- «scaleToAllSlices»: (true) When true, the scaling range is determined from all slices of «len». When false, only the values in the visible range are used.
- «scaleToSpan»: (true) When true, only the cells in the region identified by enclosing CellSpan positions are used to determine the scaling for the bars. When false, all values in the «len» array are used.
- «min», «max»: (hidden). These hidden parameters are automatically determined by scanning the relevant range of cells in «len» for the largest and smallest values. Because they are hidden, you won't see them from expression assist. When you set them, it overrides auto-scaling.
Only one cell bar appears in any given cell. They can't be over-laid.
Examples
CellBar(Self)

: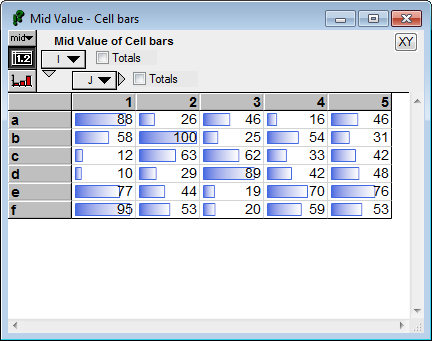

Here instead of depicting the value in the cell, the bar depicts the delta between the cell and its predecessor along I.
CellBar(( Self - Self[@I=@I-1,defval:0], color:'Green')

:

Here we see positive and negative values.
CellBar( Self, color:'LightGreen', negColor:'Pink')

: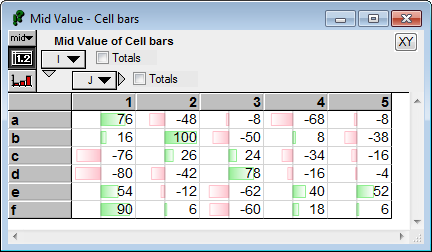

Scaling and ranges
In this example, bars are only shown in the fourth column along J
CellSpan(J, CellBar( Self, color:'LightGreen', negColor:'Pink'), 4 )

:

Notice that the bars are scaled to the range of values in that column. The bar for -68 (the smallest value in that column) goes all the way to the far left, and the bar for 40 (the largest value in that column) goes all the way to the far right. The «len» array of values that was passed to CellBars contained all the values in the array, but because «scaleToSpan» was on by default, it used only the values in the scope of the enclosing CellSpan to determine the range for plotting.
You can instruct it to use all the values in the array when scaling by setting «scaleToSpan» to false.
CellSpan(J, CellBar( Self, color:'LightGreen', negColor:'Pink', scaleToSpan:false), 4 )

: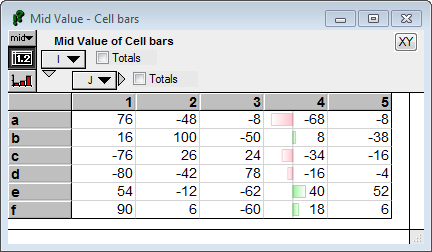

Notice that now the bar for 40 does not reach the right edge of the cell. The range is scaled to the smallest and largest values in the full array (from -80 to 100).
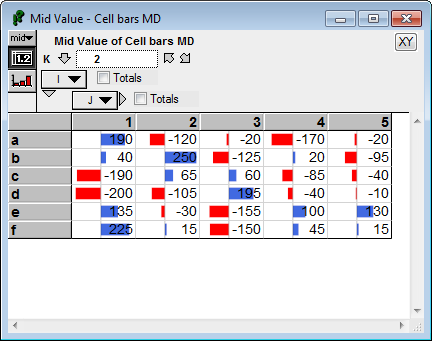
Another consideration is whether values for all slices are used, or only those from the currently visible slice. In the next example. the K=1 slice is displayed, but the scaling range is determined from the values in all slices along K, since «scaleToAllSlices» is on by default.
CellSpan(Self, gradient:false)

:

Observe that the bar for the largest value (100 does not extend to the far right, nor does the bar for the smallest value (-80) extend to the far left. This is because the K=2 slice contains more extreme values that determine the full scaling range:
:

When you set «scaleToAllSlices» to false, then only the values in the currently displayed slice influence the scaling range.
CellBar(Self, gradient:false, scaleToAllSlices:false )

:

Enable comment auto-refresher