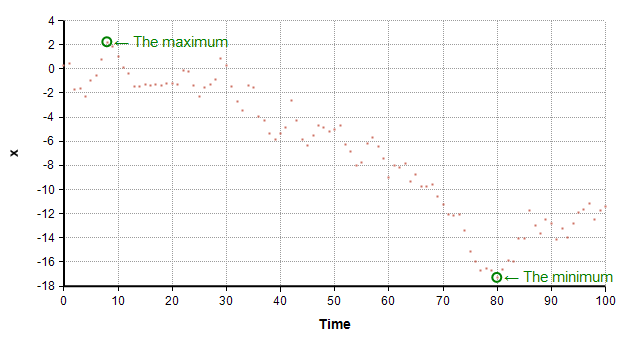
OnGraphDraw/Label Minimum and maximum
This illustrative OnGraphDraw example labels the minimum and maximum of a graph. It is provided to help you learn how to create your own OnGraphDraw embellishments.

About the example
This example here is intentionally kept simple so that it is more of a tutorial that a fully robust example. In particular, we will not be worrying about our annotations falling off the edge of the visible area then the min or max occurs too close to the right edge, and we will not worry about the possibility of our annotations overlapping each other.
Before starting
Before you can use the OnGraphDraw attribute, you need to make it visible. You only need to do this once for a given model, by following these steps:
- Open the Attributes dialog by selecting Attributes... from the Objects menu.
- Ensure class=Variables is selected at the top.
- Click twice on OnGraphDraw so that a check mark appears by it.
- Press OK
A variable with some data
You'll need some data for your plot. For some random data do this:
- Select Edit Time on the Definition menu, and set its definition to
0..100 - Create a variable, MyData, defined as:
Cumulate( Random(Normal(0,1,over:Time)), time)
The annotation
I'm going to show you how to create a simple User-Defined Function that annotates the min and max of a graph. If this is something you do on a regular basis, you would file this function away in a library, and all you have to do is call this function from OnGraphDraw. Once you have this function, from the Object Window of your result variable, just set the OnGraphDraw attribute to
- Annotate_Min_And_Max(canv, info, roles, Self, Time)
Note that canv</canv>, info, roles and Self are local variables provided automatically to the expression in OnGraphDraw.
The functions
Create a new UDF as follows:
And create a second UDF that does the heavy lifting:
- Function
Annotate_point( canv, info, roles, x, y, label )
Enable comment auto-refresher