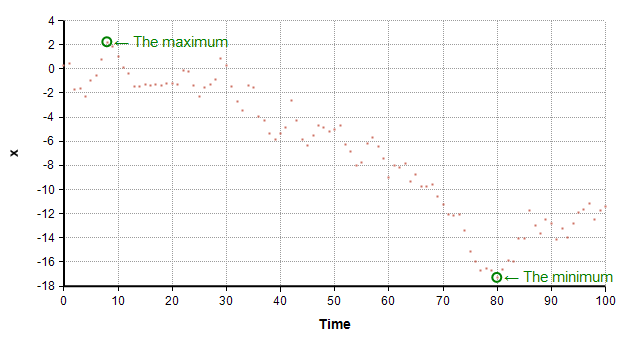
OnGraphDraw/Label Minimum and maximum
This illustrative OnGraphDraw example labels the minimum and maximum of a graph. It is provided to help you learn how to create your own OnGraphDraw embellishments.

About the example
This example here is intentionally kept simple so that it is more of a tutorial that a fully robust example. In particular, we will not be worrying about our annotations falling off the edge of the visible area then the min or max occurs too close to the right edge, and we will not worry about the possibility of our annotations overlapping each other.
Before starting
Before you can use the OnGraphDraw attribute, you need to make it visible. You only need to do this once for a given model, by following these steps:
- Open the Attributes dialog by selecting Attributes... from the Objects menu.
- Ensure class=Variables is selected at the top.
- Click twice on OnGraphDraw so that a check mark appears by it.
- Press OK
A variable with some data
You'll need some data for your plot. For some random data do this:
- Select Edit Time on the Definition menu, and set its definition to
0..100 - Create a variable, MyData, defined as:
Cumulate( Random(Normal(0,1,over:Time)), time)
View the result and set its line style to points only. You should see something similar to the above plot, but probably with different random data, and without the minimum and maximum annotations yet.
The annotation
I'm going to show you how to create a simple User-Defined Function that annotates the min and max of a graph. If this is something you do on a regular basis, you would file this function away in a library, and all you have to do is call this function from OnGraphDraw. Once you have this function, from the Object Window of your result variable, just set the OnGraphDraw attribute to
- Annotate_Min_And_Max(canv, info, roles, Self, Time)
Note that canv, info, roles and Self are local variables provided automatically to the expression in OnGraphDraw. Our call forwads these to the UDF so it can make use of the information in those, and can draw to the canvas, canv.
Also in the OnGraphDraw attribute in the Object Window of your result variable, make sure it is set to evaluate only "after fully drawn". So it looks like this:
The functions
Create a new UDF as follows:
And create a second UDF that does the heavy lifting:
- Function
Annotate_point( canv, info, roles, x, y, label )- Local (xPix, yPix) := GraphToCanvasCoord( info, roles, x, y );
- CanvasDrawEllipse( canv, xPix-5, yPix-5, 10, 10, lineColor:'Green', lineWidth:2 );
- CanvasDrawText(canv, "← " & label, xPix + 5, yPix, vAlign:'Middle', color:'Green' )
The first UDF identifies the coordinates of the two points. The second UDF draws the annotation for a point at (x,y). This annotation consists of a circle around the point and a textual label with a left-arrow.
The only tricky part in all of this is the transformation from data coordinates to pixel coordinates. The (x,y) passed into the 2nd UDF, Annotate_point, has x and y in data coordinates. The built-in function GraphToCanvasCoord transforms these to pixel coordinates that can be used by the canvas drawing functions. GraphToCanvasCoord has two return values -- to capture both, the names of the two locals are in parentheses, this declares that they capture the first two return values from the expression.
Limitations
You may find that one of your annotations goes off the edge of the plot, for example if the maximum value occurs very close to the right-hand side of the chart. If this happens, dirty the definition of the variable (i.e., by inserting a space in the Definition) to cause it to select new random points, and repeat this until your minimum and maximum are not near the right-edge. Or, you can go into Graph setup / Axis ranges and scale the horizontal from 0 to 120 so there is room.
A more sophisticated version of Annotate_point might move the annotation to the left side of the point when the point is too close to the edge. This is left as an exercise. (Hint: You'll need the plot area, which is provided in «info»). A much more difficult extension would be to ensure that the two annotations never overlap.
Enable comment auto-refresher