Parametric analysis
A potent source of insight into a model is examining the behavior of its outputs as you systematically vary one or more of its inputs. This technique is called model behavior analysis. Each input that you vary systematically is called a parameter, and so this technique is also known as parametric analysis. Analytica makes it simple to analyze model behavior in this way. All you have to do is to assign a list of alternative values to selected input parameter. When you view the result of any output, Analytica computes and displays a table or graph showing how the output values vary for all combinations of the input values.
This chapter describes how to perform a parametric analysis on a model: how to select variables as parameters, how to specify alternative values for the parameters, and how to examine the results.
Parametric analysis
The first step in analyzing model behavior is to select one or more input variables as parameters and to assign each parameter a list of possible values.
Which inputs to vary?: You can vary any numerical input variable of your model, including decision and chance variables. Often you will want to vary each decision variable to see which value gives the best results according to the objectives. You might also want to vary some chance variables to see how they affect the results. It is often best to look first at the decision or chance variables that you expect to have the largest effect on the model outputs. In complicated models, you might want to start with an importance analysis, to identify which chance variables are likely to be most important. (See Statistics, Sensitivity, and Uncertainty Analysis). You can then select the most important variables as the parameters to vary to analyze model behavior.
How many values to assign?: Usually it is best to assign a list of three alternative values to each parameter — a low, medium, and high value. In some cases, two values are sufficient. If you have a special interest in a particular parameter (for example, if you suspect it has a strongly nonlinear effect) you can assign more than three values to examine in more detail the model behavior as the parameter varies. Naturally, the computation time increases with the number of values.
Creating a list: Change the definition of each parameter to a list, thus:
- Select the variable by clicking its node in the influence diagram.
- Display the variable’s definition by clicking the Definition button
 in the tools palette, or press Control+e.
 - Click the expr (Expression) menu above the definition and select the List option. (Do not select the List of Labels option.)

- A dialog asks for confirmation. Click OK. A list with one item displays, containing the old definition of the variable.

- Click the item to select it.
- Type in the lowest value for the variable.
- Press Enter and type in the next value.
- Repeat step 7 until you have all the values you want.


How many inputs to vary: For details on how to edit a list, see Editing a list.
If you want to create a list of successive integers, use the .. operator, for example:
Decision Year := 2000 .. 2010
If you want to create a list of evenly spaced numbers, use the Sequence() function, for example:
Decision Quarters := Sequence(2000, 2010, 0.25)
Typically you should start a model behavior analysis by varying just one input variable, the one you expect to be most important. Vary additional variables one at a time, in order of their expected importance. If a variable turns out to have little effect, you can restore it to its original value or probability distribution. If you have many inputs whose effects on model behavior you would like to explore, vary just a few at a time, rather than trying to vary them all simultaneously.
Each parameter that you vary becomes a new dimension of your output result array. The computation time and memory needed increase roughly exponentially as you add parameters. Moreover, you might find it hard to interpret an array with more than three or four dimensions.
Remember that the goal is to obtain insight into what affects the model behavior and how.
Parametric analysis results
When you have assigned a list to one or more inputs, you can examine their effect by viewing the result on an output variable. If your model has an objective, start by looking at that variable.
- Select the variable you wish to view by clicking its node in the diagram.
- View the result by clicking the Result button
 in the navigation toolbar. The result displays as a table or graph.

The result is an array with a dimension for each input parameter that you have varied (in this example, Buying price and Appreciation rate). If an input parameter does not appear as a dimension of the result, it implies that the result variable does not depend on the input. The result might also have other dimensions that are not input parameters you have varied — for example, Time for a dynamic model.
It is generally easiest to look first at the result graph to see the model’s general behavior. You need to look only at the result table if you want to see the precise numerical values. If you are varying more than one input parameter, try rearranging the dimensions (see Index selection to get additional insights into model behavior).

Understanding unexpected behavior: If you find the model’s behavior unexpected or inexplicable, you might want to look more deeply into how the behavior arises. An easy way to do this is simply to look at the results for other variables between the input(s) and the output(s) in which you’re interested. You can work forward from an input towards the output, or backward from the output towards the inputs. Look at the behavior of each intermediate variable, and see if you can understand why the inputs affect it the way they do.
Typically, the reason for unexpected behavior will quickly become clear to you. It might be that some intermediate relationship has an effect different from what you expected. There might be an error in a definition. In either case, this kind of exploration can be very revealing about the model. You might end up improving the model or gaining a deeper understanding of the system it represents.
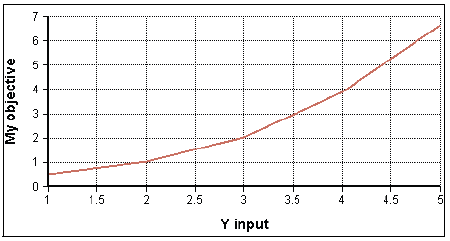
Understanding model behavior: By examining result graphs, you can learn if each input affects the output, if the effect is linear or non-linear, and if there are interactions among inputs in their effect on the output. Below are some typical graph patterns and their qualitative interpretations.
- A horizontal line shows that changes in the input over the specified range have no effect on the output.

- A straight line shows that the output depends linearly on the input — provided that you have specified more than two different values for the input.

- A bent or curved line shows that there is a nonlinear dependence. (If you have only two values for the input, the graph will be a straight line even if there is a nonlinear dependence.)


See Also
- Parametric Analysis
- Using Parametric Analysis with Optimization
- Using Parametric Analysis: Airline NLP Module 2
- Selective Parametric Analysis
- Conventions for parameters and operands
- Function calls and parameters
- Classes of variables and other objects
Enable comment auto-refresher