Uploads by Lchrisman
This special page shows all uploaded files.

| Date | Name | Thumbnail | Size | Description | Versions |
|---|---|---|---|---|---|
| 00:48, 16 January 2021 | AnalyticaPythonConnector.py (file) |  |
1 KB | 1 | |
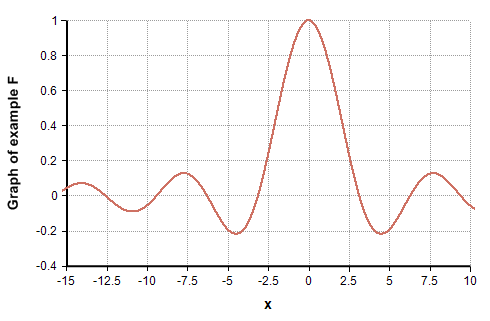
| 06:35, 18 October 2020 | Graph of example F Gauss Quadrature.png (file) |  |
10 KB | 1 | |
| 06:31, 18 October 2020 | Accuracy gauss quadrature example.png (file) |  |
14 KB | 1 | |
| 06:12, 18 October 2020 | Legendre library.ana (file) | |
139 KB | 1 | |
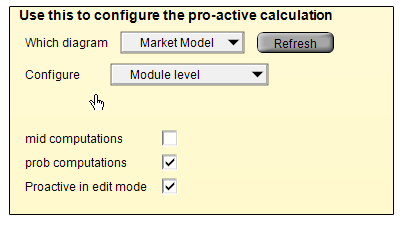
| 00:01, 16 October 2020 | Configure proactive configuration.png (file) |  |
11 KB | 1 | |
| 16:47, 9 October 2020 | Power Law Exceedance.png (file) |  |
9 KB | 1 | |
| 20:33, 30 September 2020 | MECOLS0620.xlsx (file) | |
1.27 MB | Spreadsheet that accompanies the Time-of-use pricing example model. | 1 |
| 20:33, 30 September 2020 | Time of use pricing.ana (file) | |
20 KB | Model developed during a User Group Webinar | 1 |
| 18:23, 25 September 2020 | OnGraphClickCoord.png (file) |  |
4 KB | 1 | |
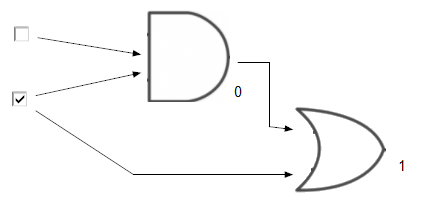
| 19:52, 24 September 2020 | Boolean circuits.png (file) |  |
15 KB | 1 | |
| 22:30, 3 September 2020 | Missing module and library.png (file) |  |
8 KB | 1 | |
| 00:46, 7 August 2020 | Hubbard HDR Library.ana (file) | |
5 KB | The HDR pseudo-random number algorithm by Doug Hubbard, encoded in Analytica by Lonnie Chrisman | 1 |
| 23:02, 31 July 2020 | System dynamics diagram with curved arrows.png (file) |  |
42 KB | 1 | |
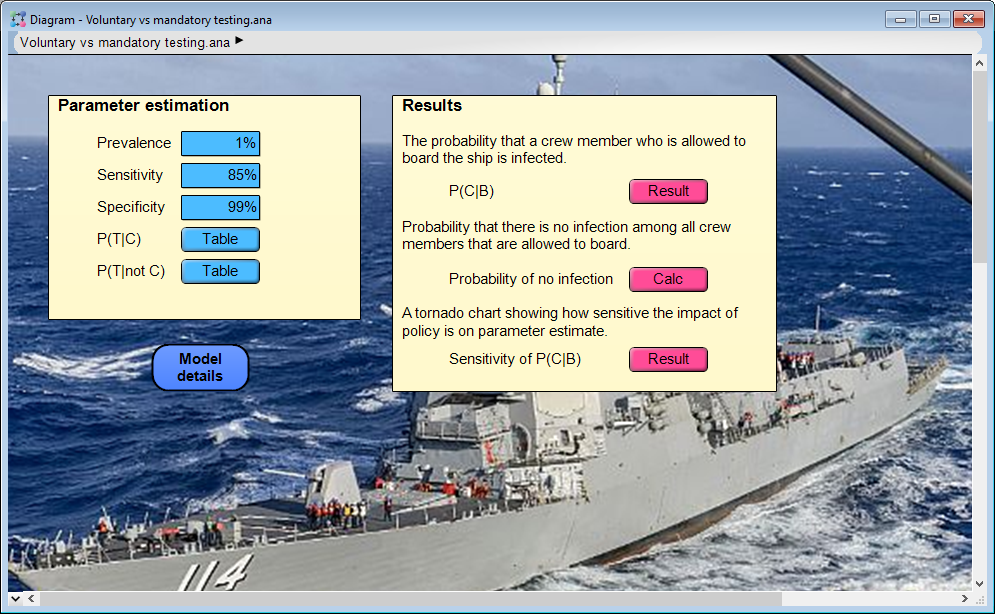
| 16:30, 22 May 2020 | Voluntary vs mandatory testing.ana (file) | |
1.18 MB | 1 | |
| 16:28, 22 May 2020 | Voluntary vs mandatory testing.png (file) |  |
593 KB | 1 | |
| 20:17, 30 April 2020 | Analytica-5.4.jpg (file) |  |
14 KB | 1 | |
| 18:44, 18 April 2020 | Modelo Epidemiologoco para el Covid-19 con cuarentena.ana (file) | |
29 KB | 1 | |
| 23:47, 1 April 2020 | US COVID-19 Data.ana (file) | |
13 KB | 1 | |
| 16:51, 26 March 2020 | RobBrownCovidMarkovModelScreenShot.png (file) |  |
110 KB | 1 | |
| 16:45, 26 March 2020 | COVID Model 2020--03-25.ana (file) | |
223 KB | 1 | |
| 16:36, 26 March 2020 | COVID-State-Simulator.png (file) |  |
138 KB | Screenshot of Cory's model | 1 |
| 17:10, 24 March 2020 | COVID-19 Triangle Suppression.ana (file) | |
74 KB | Identical to previous except I changed "saved version" to 5.3 (was 5.4) so people don't get a warning when opening it. | 2 |
| 03:12, 20 March 2020 | Corona Markov.ana (file) | |
26 KB | 1 | |
| 23:22, 10 March 2020 | Simple COVID-19.ana (file) | |
20 KB | 1 | |
| 23:33, 2 February 2020 | Early Estimation of Mortality rate for Wuhan virus.ana (file) | |
8 KB | 1 | |
| 00:28, 28 January 2020 | RootLonnieCA.zip (file) | |
1 KB | 1 | |
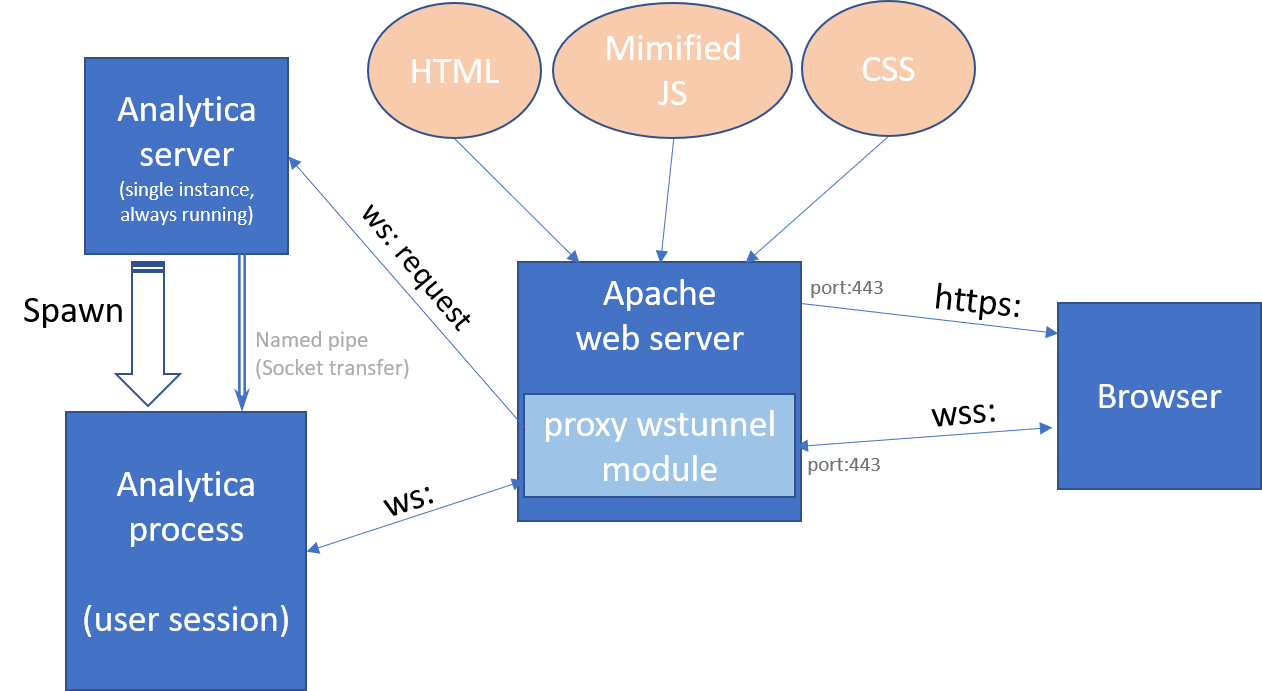
| 21:01, 23 January 2020 | Suan on apache architecture.png (file) |  |
61 KB | 1 | |
| 19:04, 11 January 2020 | Suan on webserver architecture.png (file) |  |
67 KB | 2 | |
| 18:56, 11 January 2020 | Suan as web server configuration single user.png (file) |  |
34 KB | 1 | |
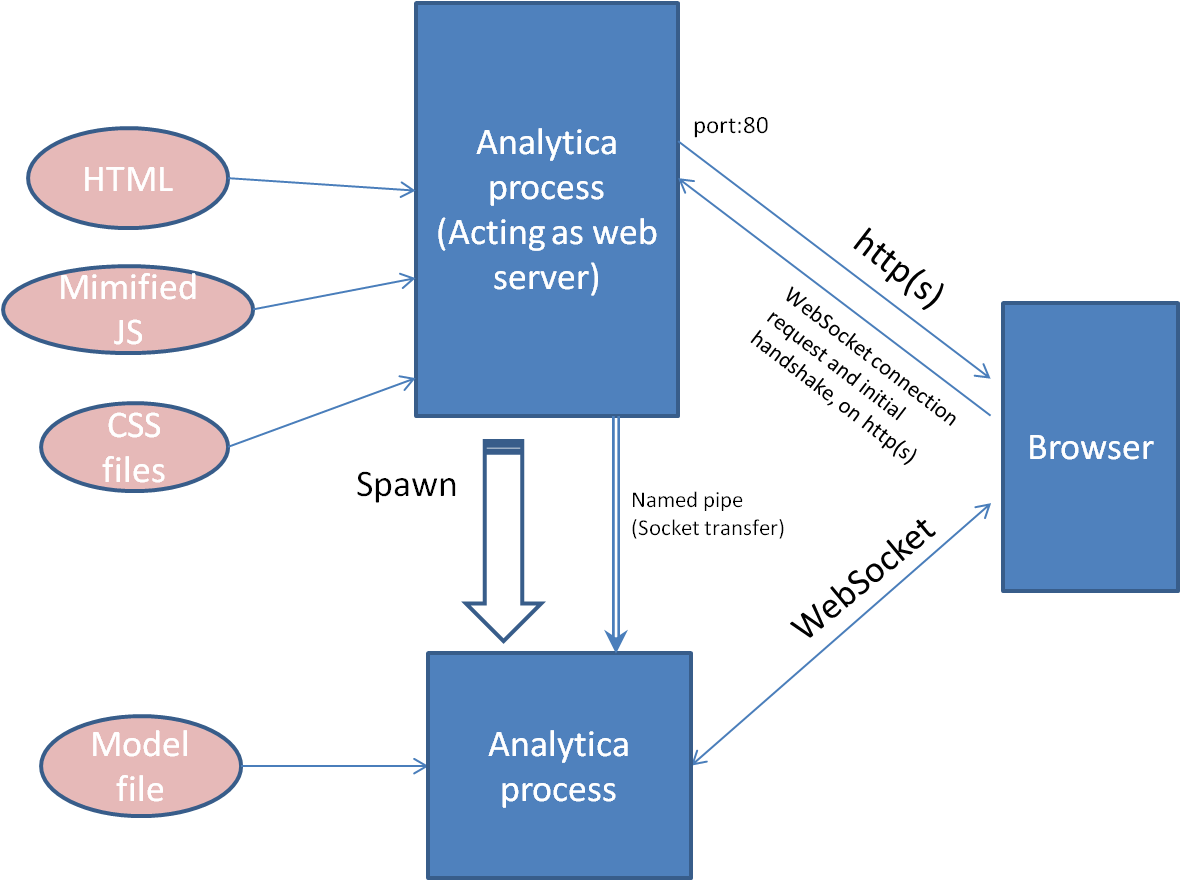
| 18:56, 11 January 2020 | Suan as web server architecture.png (file) |  |
63 KB | 1 | |
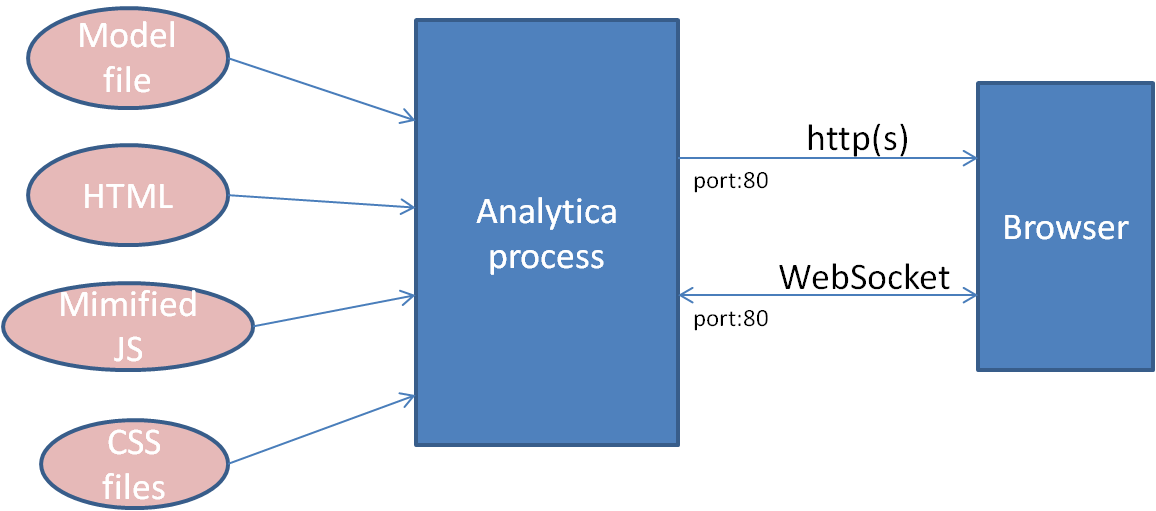
| 18:28, 11 January 2020 | Suan Single user deployment architecture.png (file) |  |
33 KB | 1 | |
| 17:34, 11 January 2020 | Sequential dispatch test.ana (file) | |
3 KB | 1 | |
| 17:34, 11 January 2020 | Sequential dispatch library.ana (file) | |
2 KB | 1 | |
| 00:59, 11 January 2020 | Suan Single User UI Dev Architecture.png (file) |  |
47 KB | 1 | |
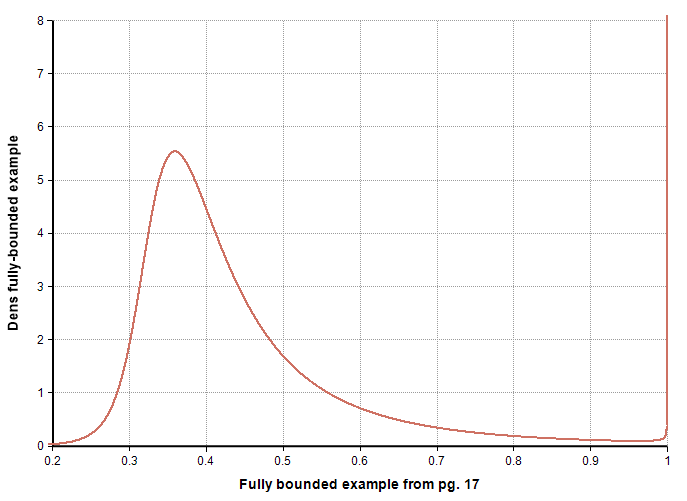
| 20:09, 31 December 2019 | Cowlick CDF step.png (file) |  |
14 KB | 1 | |
| 20:06, 31 December 2019 | Hadlock bickel fig7b.png (file) |  |
26 KB | The figure from Hadlock & Bickel (2017), Figure 7b, with an arrow added | 1 |
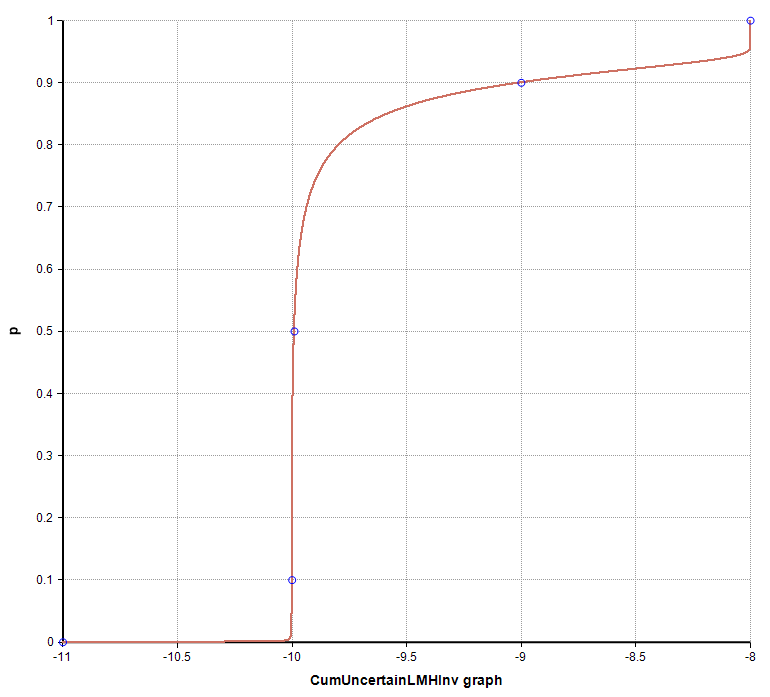
| 20:03, 31 December 2019 | Cowlick graph.png (file) |  |
15 KB | Shows the cowlick oddity in the Hadlock & Bickel distribution at the upper bound, where it jumps to infinity. | 1 |
| 20:24, 11 October 2019 | Sum of LogNormal Library to N=300.ana (file) | |
111 KB | A revision of the average-of-log-normal algorithm with a Q-table extended to N=300 | 1 |
| 18:37, 23 September 2019 | VirdisNodeColorEx.png (file) |  |
62 KB | An example diagram that uses the Virdis node style coloration scheme provided with the Analytica 5.3 release. | 1 |
| 00:02, 7 May 2019 | Sum of LogNormal Library.ana (file) | |
70 KB | I added an «over» parameter to SoLN and AoLN functions. | 2 |
| 23:41, 6 May 2019 | SoLN34 compare CDF.png (file) |  |
12 KB | 1 | |
| 23:41, 6 May 2019 | SoLN34 compare PDF.png (file) |  |
14 KB | 1 | |
| 03:08, 29 April 2019 | Sum of LogNormal Q-tables.xlsx (file) | |
59 KB | 1 | |
| 00:50, 19 March 2019 | Solid prob band example.png (file) |  |
22 KB | 1 | |
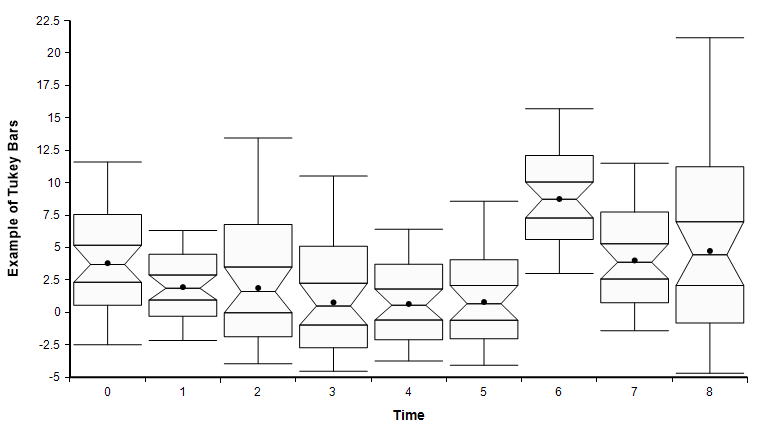
| 00:34, 19 March 2019 | Example of Tukey bars.png (file) |  |
18 KB | 1 | |
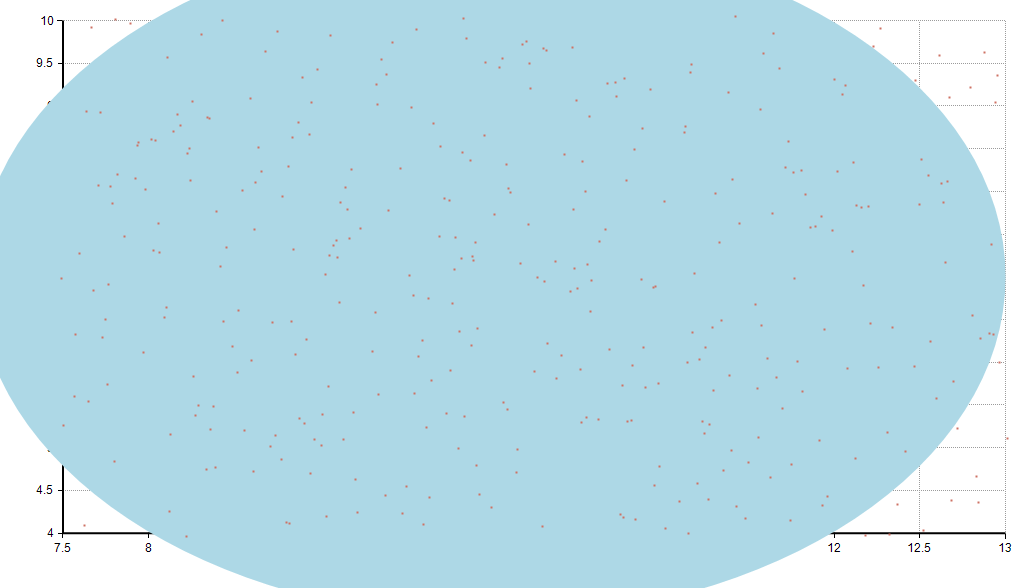
| 00:24, 19 March 2019 | Plot with clip.png (file) |  |
17 KB | 1 | |
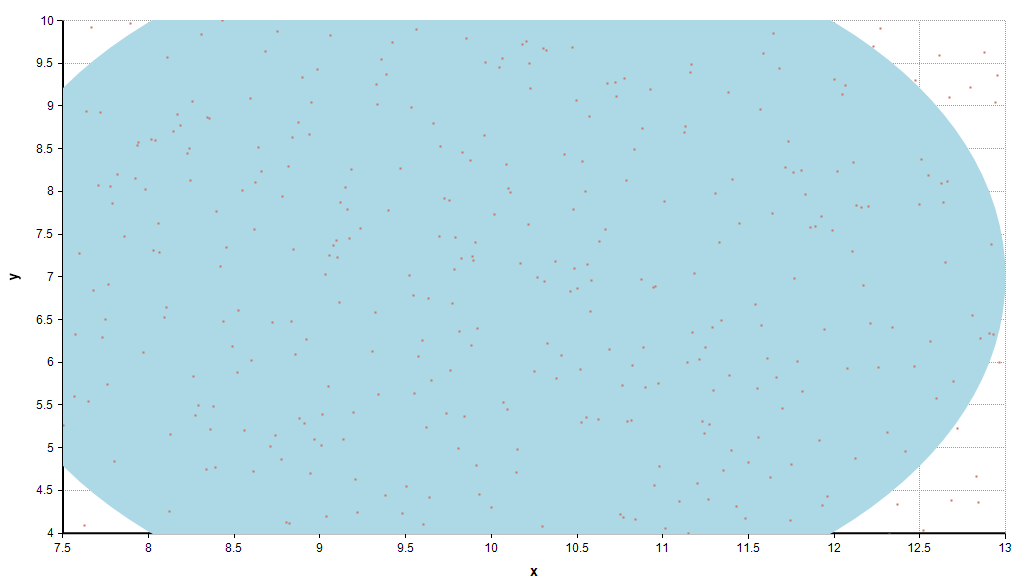
| 00:21, 19 March 2019 | Plot without clip.png (file) |  |
16 KB | 1 | |
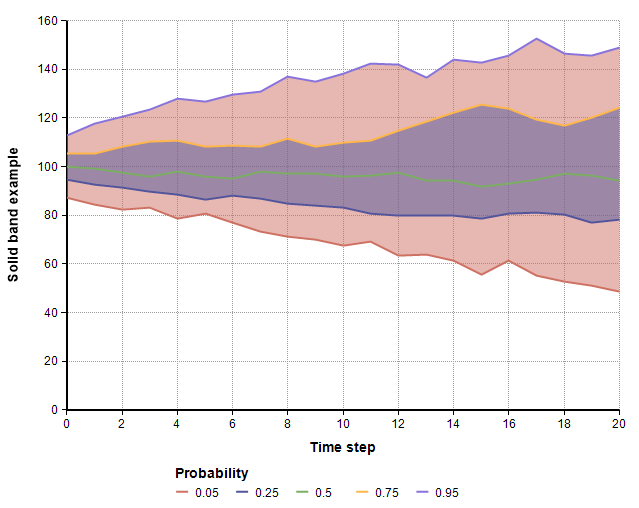
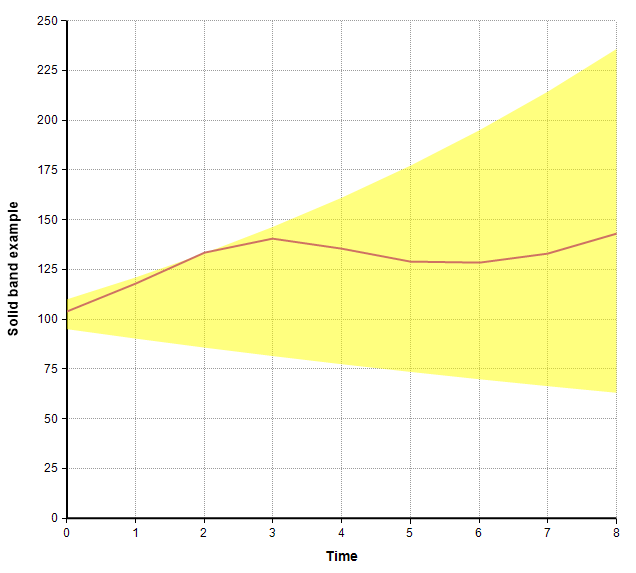
| 19:06, 18 March 2019 | Solid band example.png (file) |  |
18 KB | 1 | |
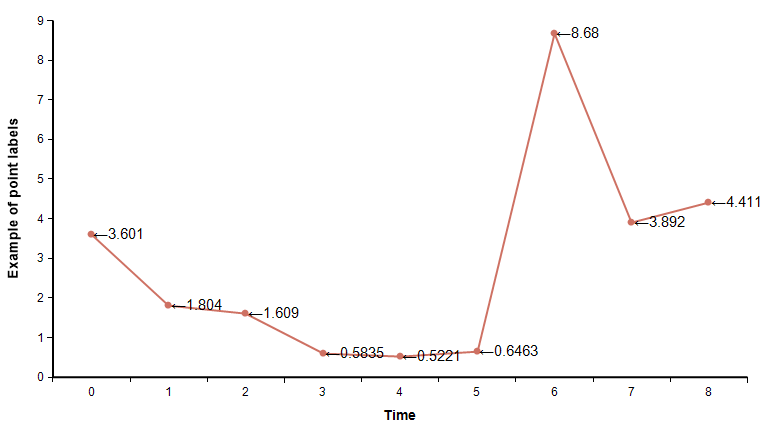
| 18:58, 18 March 2019 | Example of point labels.png (file) |  |
16 KB | 1 | |
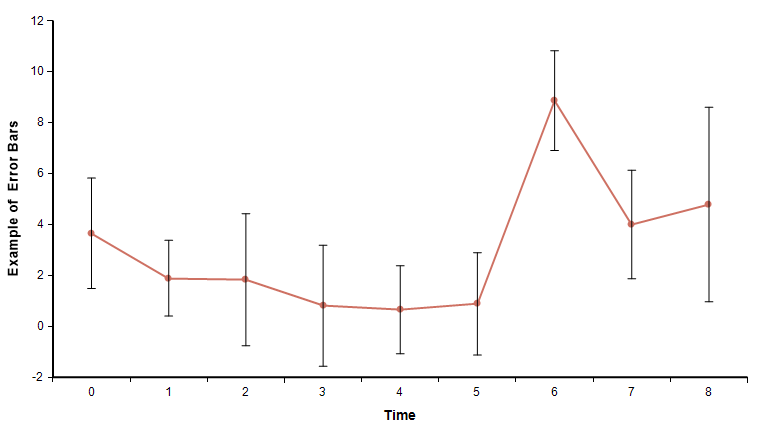
| 18:35, 18 March 2019 | Example of Error Bars.png (file) |  |
14 KB | 1 |