Uploads by Lchrisman
This special page shows all uploaded files.


| Date | Name | Thumbnail | Size | Description | Versions |
|---|---|---|---|---|---|
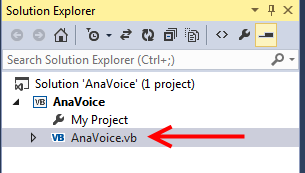
| 00:31, 9 May 2015 | VB COM Rename File.png (file) |  |
10 KB | 1 | |
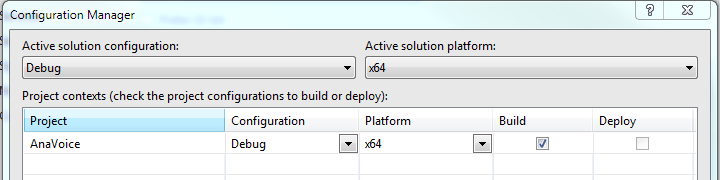
| 00:29, 9 May 2015 | VB COM Configuration Manager.png (file) |  |
19 KB | 1 | |
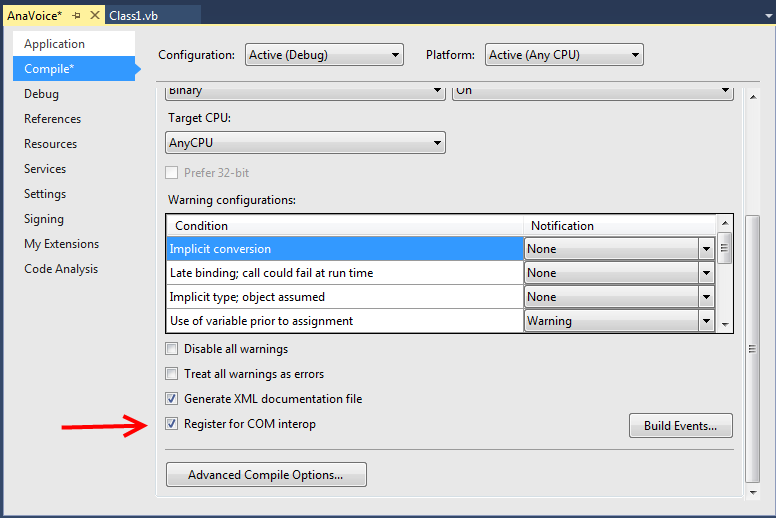
| 00:03, 9 May 2015 | VB COM Register for COM interop.png (file) |  |
37 KB | 1 | |
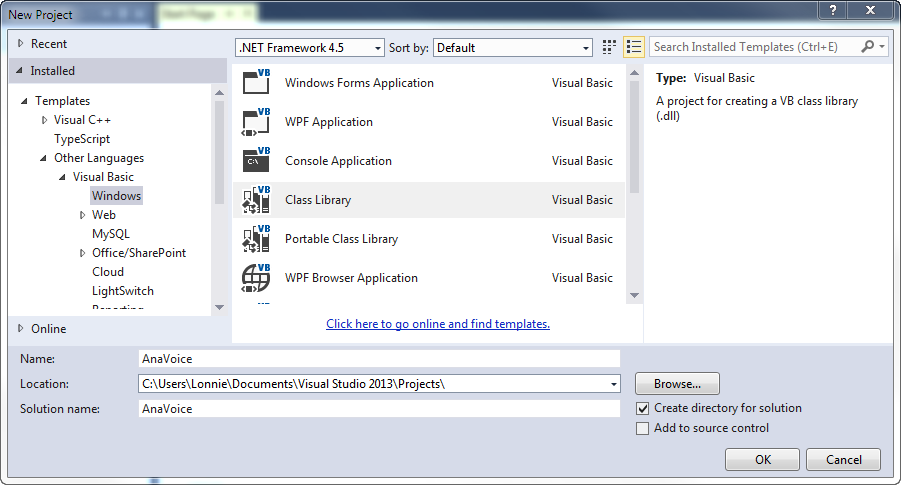
| 23:59, 8 May 2015 | VB COM New Project.png (file) |  |
52 KB | 1 | |
| 22:40, 27 April 2015 | Paired dependencies.png (file) |  |
9 KB | 1 | |
| 22:35, 17 March 2015 | Color Series Superset Index.png (file) |  |
9 KB | forgot the arrow | 3 |
| 22:31, 17 March 2015 | Color Series Index Assoc.png (file) |  |
7 KB | Change of text and order | 2 |
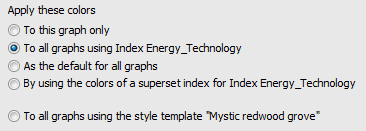
| 22:29, 17 March 2015 | Color Series Template Radio.png (file) |  |
6 KB | text and order changes | 2 |
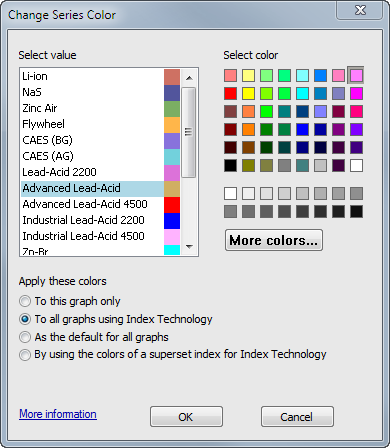
| 22:19, 17 March 2015 | Change Series Color.png (file) |  |
23 KB | 4 | |
| 22:02, 6 March 2015 | Aggregation challenges.ana (file) |  |
413 KB | Challenge problems to develop your Analytica expression writing skills. | 1 |
| 06:34, 4 March 2015 | Solar Panel Analysis.ana (file) | |
17 KB | Model created during the Solar Panel analysis video | 1 |
| 06:33, 4 March 2015 | Solar Panel Analysis Video.ana (file) | |
17 KB | Model created during the Solar Panel analysis video | 1 |
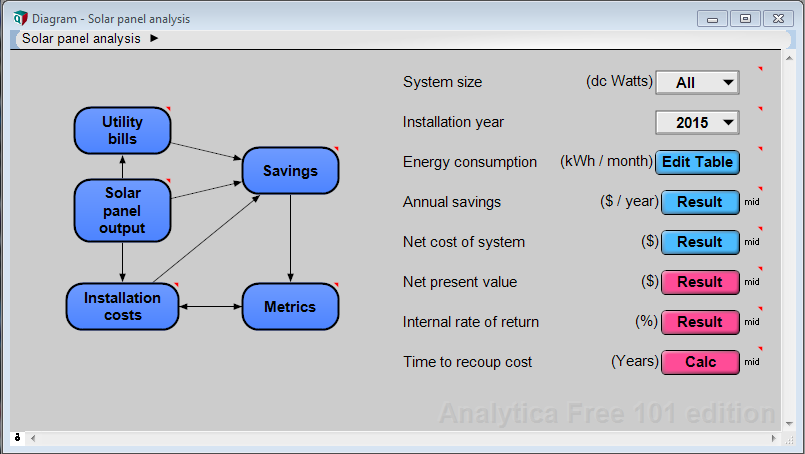
| 06:06, 4 March 2015 | Solar Panel Analysis.png (file) |  |
52 KB | Screen shot of the solar panel analysis model | 1 |
| 21:36, 24 February 2015 | Heat map.ana (file) | |
4 KB | 1 | |
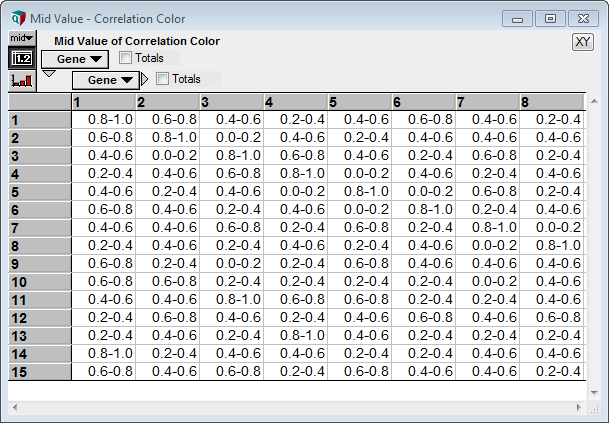
| 21:13, 24 February 2015 | Heat map table.png (file) |  |
22 KB | 1 | |
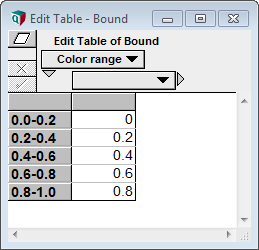
| 21:09, 24 February 2015 | Heat map bound.png (file) |  |
9 KB | 1 | |
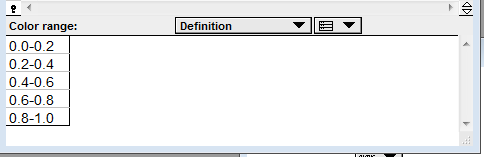
| 21:07, 24 February 2015 | Heat map color range.png (file) |  |
5 KB | 1 | |
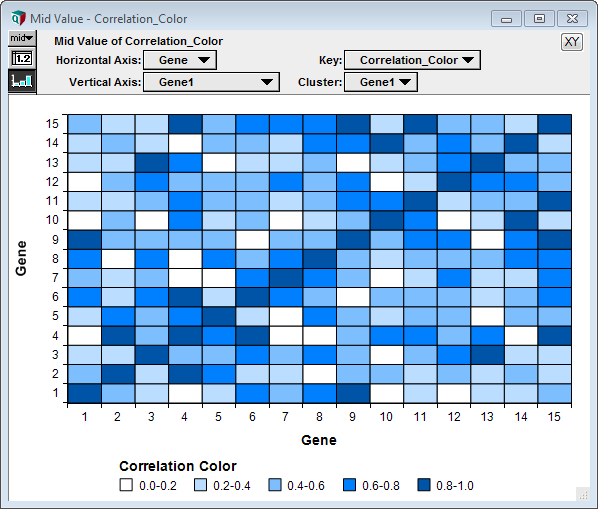
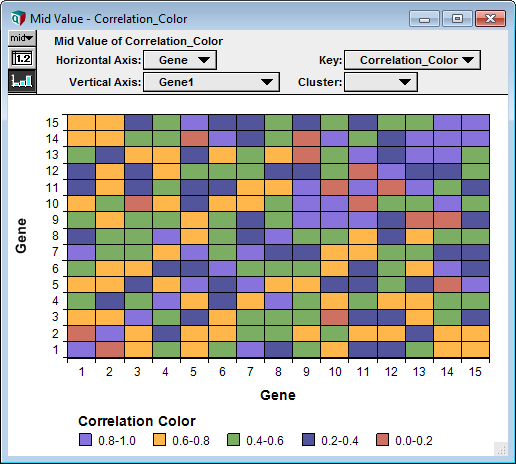
| 20:58, 24 February 2015 | Bar HeatMap2.png (file) |  |
28 KB | With Windows borders | 3 |
| 20:19, 24 February 2015 | XY.png (file) |  |
929 bytes | The XY button on a graph result window | 1 |
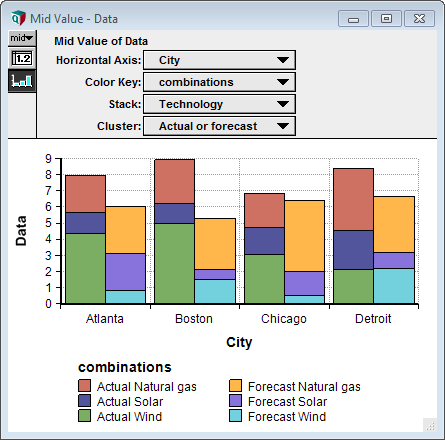
| 20:12, 24 February 2015 | Stacked clustered bar chart.ana (file) | |
2 KB | Example model with stacked clustered bar chart | 1 |
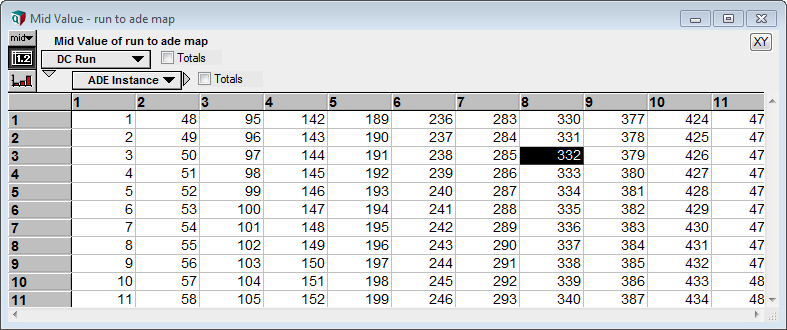
| 23:47, 3 February 2015 | Run to ade map.png (file) |  |
30 KB | 1 | |
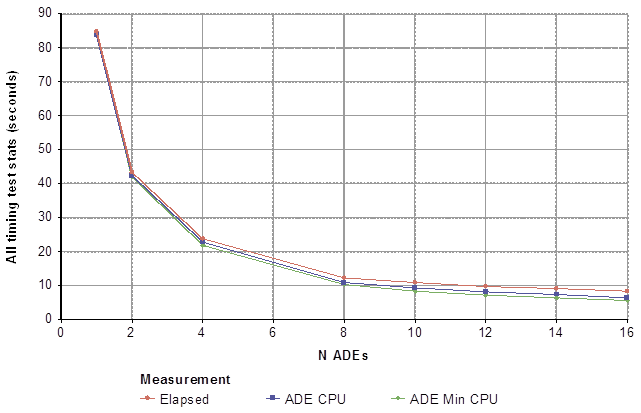
| 22:49, 3 February 2015 | Distributed-computing-speedup.png (file) |  |
18 KB | 1 | |
| 19:18, 27 January 2015 | Err42425.png (file) |  |
10 KB | 1 | |
| 03:50, 26 January 2015 | Marginal abatement home heating.ana (file) | |
7 KB | Example model from the Marginal Abatement blog article | 1 |
| 03:49, 26 January 2015 | Marginal abatement heating energy.png (file) |  |
14 KB | 1 | |
| 19:25, 30 October 2014 | MT create5.png (file) |  |
19 KB | 1 | |
| 19:24, 30 October 2014 | MT create4.png (file) |  |
20 KB | 1 | |
| 19:24, 30 October 2014 | MT create3.png (file) |  |
26 KB | 1 | |
| 19:23, 30 October 2014 | MT create2.png (file) |  |
31 KB | 1 | |
| 19:23, 30 October 2014 | MT create1.png (file) |  |
8 KB | 1 | |
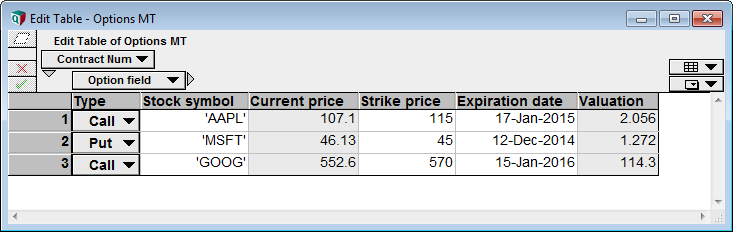
| 22:15, 14 October 2014 | MultiTable CellView.png (file) |  |
9 KB | 1 | |
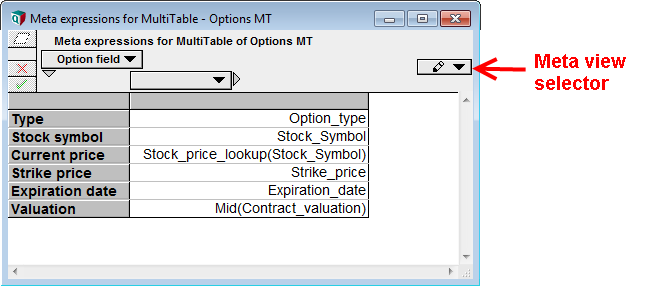
| 22:15, 14 October 2014 | MultiTable MetaView.png (file) |  |
9 KB | 1 | |
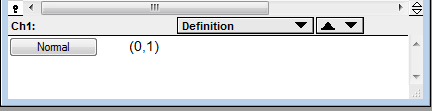
| 19:36, 14 October 2014 | Distribution button in definition.png (file) |  |
4 KB | 1 | |
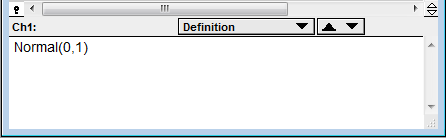
| 19:36, 14 October 2014 | Textual definition.png (file) |  |
4 KB | 1 | |
| 19:33, 14 October 2014 | Link to Wiki on context menu.png (file) |  |
11 KB | 1 | |
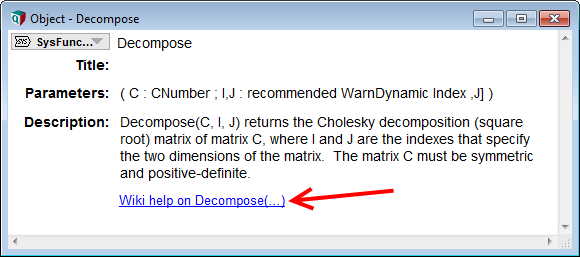
| 19:30, 14 October 2014 | Link to Wiki from Object window.png (file) |  |
17 KB | 1 | |
| 18:56, 14 October 2014 | Hyperlinks in graphs.png (file) |  |
16 KB | 1 | |
| 18:28, 14 October 2014 | Zero included.png (file) |  |
6 KB | 1 | |
| 18:27, 14 October 2014 | Zero not included.png (file) |  |
8 KB | 1 | |
| 18:27, 14 October 2014 | Manual categorical scale.png (file) |  |
45 KB | 1 | |
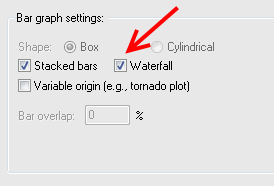
| 17:55, 14 October 2014 | Bar graph settings showing Waterfall.png (file) |  |
5 KB | 1 | |
| 17:45, 14 October 2014 | Computed color role.png (file) |  |
40 KB | 1 | |
| 15:39, 14 October 2014 | Color varies by slice2.png (file) |  |
18 KB | 1 | |
| 15:39, 14 October 2014 | Color varies by slice1.png (file) |  |
19 KB | 1 | |
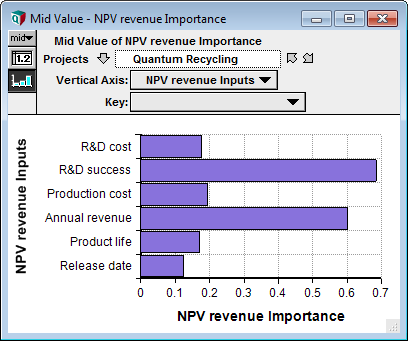
| 15:34, 14 October 2014 | 1-D bar color varies.png (file) |  |
26 KB | 1 | |
| 03:20, 14 October 2014 | Bar HeatMap.png (file) |  |
17 KB | 1 | |
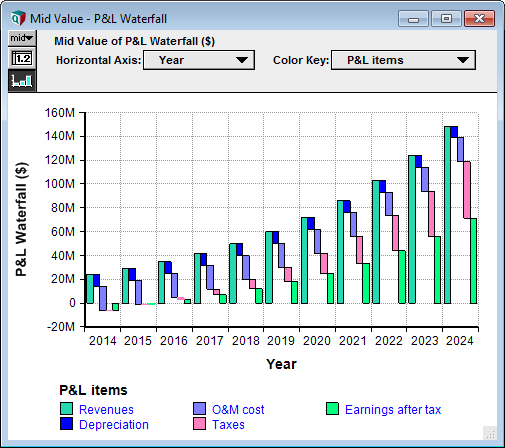
| 03:19, 14 October 2014 | Waterfall chart.png (file) |  |
24 KB | 1 | |
| 03:16, 14 October 2014 | Stacked clusters.png (file) |  |
18 KB | 1 | |
| 19:42, 13 October 2014 | Original for input node popup.png (file) |  |
7 KB | 1 | |
| 19:41, 13 October 2014 | Original for output node popup.png (file) |  |
8 KB | 1 |