File list
This special page shows all uploaded files.
| Date | Name | Thumbnail | Size | User | Description | Versions |
|---|---|---|---|---|---|---|
| 09:54, 9 February 2007 | AskMsgTextDialog.jpg (file) |  |
7 KB | Lchrisman | Screenshot of the AskMsgText box | 1 |
| 09:43, 9 February 2007 | AskMsgNumberDialog.jpg (file) |  |
8 KB | Lchrisman | Screenshot of the dialog produced by AskMsgDialog | 1 |
| 09:30, 9 February 2007 | ShowProgressBarDialog.jpg (file) |  |
7 KB | Lchrisman | Screenshot of the ShowProgressBar dialog. | 1 |
| 03:53, 7 February 2007 | HistogramExample3.jpg (file) |  |
62 KB | Lchrisman | screenshot for histograph plotting example | 2 |
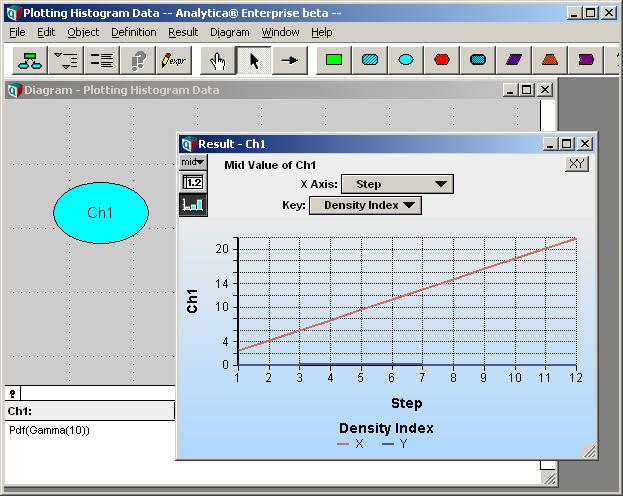
| 01:06, 7 February 2007 | HistogramExample2.jpg (file) |  |
58 KB | Lchrisman | Screenshot used in the plotting a histogram tutorial | 1 |
| 01:05, 7 February 2007 | TableModeIcon.jpg (file) |  |
979 bytes | Lchrisman | The table button on a result window that switches to table view. | 1 |
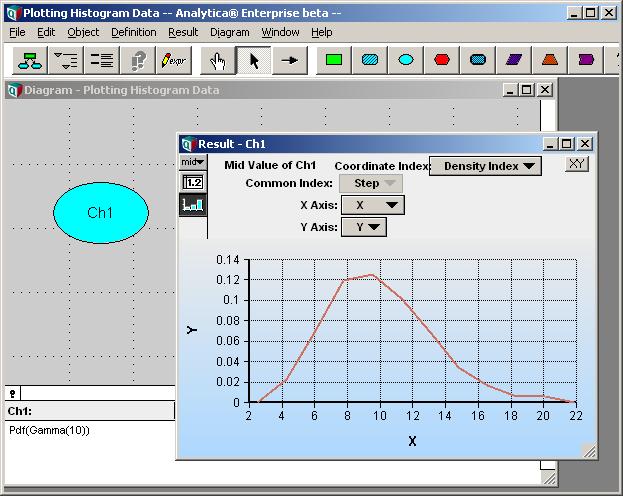
| 01:05, 7 February 2007 | HistogramExample1.jpg (file) |  |
63 KB | Lchrisman | Screenshot for plotting a histogram example. | 2 |
| 00:57, 7 February 2007 | ResultToolbarButton.jpg (file) |  |
1 KB | Lchrisman | The "show result" button on the Analytica toolbar, resembles [?!] | 1 |
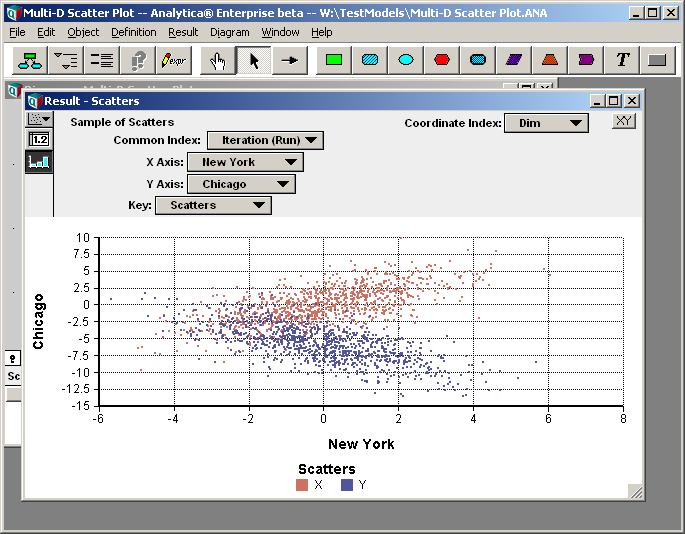
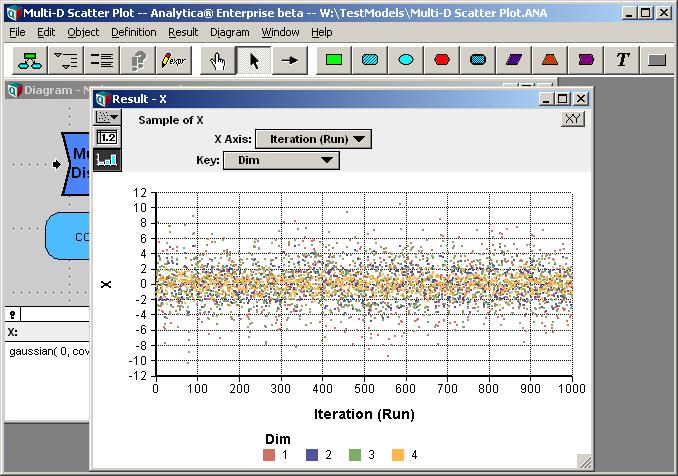
| 22:31, 6 February 2007 | ScatterExample18.jpg (file) |  |
78 KB | Lchrisman | Screenshot used in Scatter plot Tutorial | 1 |
| 22:22, 6 February 2007 | ScatterExample17.jpg (file) |  |
79 KB | Lchrisman | Screenshot used in scatter plot tutorial | 1 |
| 22:17, 6 February 2007 | ScatterExample16.jpg (file) |  |
56 KB | Lchrisman | Screenshot for scatter plot tutorial. | 1 |
| 22:14, 6 February 2007 | ObjectWindowToolbarButton.jpg (file) |  |
1 KB | Lchrisman | The toolbar icon button that opens the object window. | 1 |
| 22:08, 6 February 2007 | ScatterExample15.jpg (file) |  |
55 KB | Lchrisman | Screenshot used in scatter plot example | 1 |
| 22:07, 6 February 2007 | ScatterExample14.jpg (file) |  |
54 KB | Lchrisman | screenshot used by scatter plot tutorial | 1 |
| 22:07, 6 February 2007 | ScatterExample13.jpg (file) |  |
60 KB | Lchrisman | screenshot used in scatter example | 1 |
| 21:55, 6 February 2007 | ScatterExample12.jpg (file) |  |
77 KB | Lchrisman | Screenshot used in scatter plot tutorial | 1 |
| 21:51, 6 February 2007 | ScatterExample11.jpg (file) |  |
55 KB | Lchrisman | Screenshot used in scatter plot tutorial | 1 |
| 21:22, 6 February 2007 | ScatterExample10.jpg (file) |  |
71 KB | Lchrisman | Screenshot used in scatter plot example | 1 |
| 21:20, 6 February 2007 | ScatterExample9.jpg (file) |  |
69 KB | Lchrisman | Screenshot used in scatter plot tutorial | 1 |
| 21:19, 6 February 2007 | GraphModeIcon.jpg (file) |  |
1,023 bytes | Lchrisman | The icon/button on a result view that switches to graph mode. | 1 |
| 21:15, 6 February 2007 | OKbutton.jpg (file) |  |
1 KB | Lchrisman | The OK button | 1 |
| 21:13, 6 February 2007 | ScatterExample8.jpg (file) |  |
70 KB | Lchrisman | Screenshot used in scatter plot tutorial | 1 |
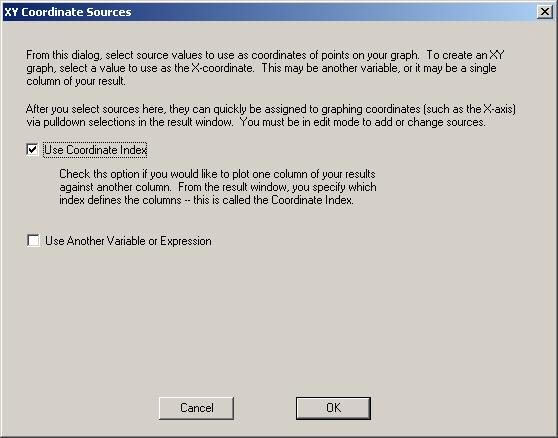
| 21:09, 6 February 2007 | Use Coordinate Index dialog.jpg (file) |  |
34 KB | Lchrisman | Screen shot of the XY Coordinate Sources dialog with "Use Coordinate Index" checked. | 1 |
| 21:07, 6 February 2007 | XYbutton.jpg (file) |  |
844 bytes | Lchrisman | The XY button seen on a result window. This is a small icon. | 1 |
| 21:01, 6 February 2007 | ScatterExample7.jpg (file) |  |
70 KB | Lchrisman | Screenshot used in scatter plot tutorial | 1 |
| 21:00, 6 February 2007 | ScatterExample6.jpg (file) |  |
80 KB | Lchrisman | screenshot used in scatter plot tutorial | 2 |
| 20:56, 6 February 2007 | ScatterExample5.jpg (file) |  |
14 KB | Lchrisman | Changing sample size screenshot, for scatter plot example. | 1 |
| 20:52, 6 February 2007 | ScatterExample4.jpg (file) |  |
51 KB | Lchrisman | Screen shot used in Scatter Plot tutorial | 1 |
| 20:50, 6 February 2007 | ScatterExample3.jpg (file) |  |
57 KB | Lchrisman | Screenshot for tutorial on making a scatter plot. | 1 |
| 20:37, 6 February 2007 | ScatterExample2.jpg (file) |  |
49 KB | Lchrisman | Used in the scatter plot tutorial example. | 3 |
| 20:11, 6 February 2007 | ScatterExample1.jpg (file) |  |
53 KB | Lchrisman | 1 | |
| 17:15, 2 February 2007 | Icon A 64x64.png (file) |  |
5 KB | Max | 1 | |
| 17:15, 2 February 2007 | Icon A 24x24.png (file) |  |
1 KB | Max | 1 | |
| 17:14, 2 February 2007 | Icon A 32x32.png (file) |  |
2 KB | Max | 1 | |
| 17:13, 2 February 2007 | Icon Question 16x16.png (file) |  |
873 bytes | Max | 1 | |
| 17:13, 2 February 2007 | Icon Influence 16x16.png (file) |  |
920 bytes | Max | 1 | |
| 17:13, 2 February 2007 | Icon Exclamation 16x16.png (file) |  |
813 bytes | Max | 1 | |
| 17:13, 2 February 2007 | Icon A 16x16.png (file) |  |
858 bytes | Max | 1 | |
| 17:08, 2 February 2007 | Analytica cube 75px.png (file) |  |
5 KB | Max | Cube from Analytica logo | 1 |
| 17:06, 2 February 2007 | Analytica logo tagline 500px.png (file) | 28 KB | Max | Full Analytica logo with cube and tagline | 1 | |
| 04:27, 1 February 2007 | DomainPulldown.JPG (file) |  |
7 KB | Lchrisman | Screen shot showing the domain pulldown | 1 |
| 23:18, 22 January 2007 | Expr.jpg (file) |  |
1 KB | Lchrisman | The expr Icon from the Analytica toolbar. | 1 |
| 12:08, 27 November 2006 | TornadoTable1.jpg (file) |  |
25 KB | Fredbrunt | 1 | |
| 12:07, 27 November 2006 | RankCorrelSensitivityTornado.JPG (file) |  |
78 KB | Fredbrunt | 1 | |
| 12:06, 27 November 2006 | TornadoSettings1.jpg (file) |  |
28 KB | Fredbrunt | For tornado plot page | 1 |
| 12:06, 27 November 2006 | TornadoPlot1.jpg (file) |  |
92 KB | Fredbrunt | For tornado plot page | 1 |
| 12:05, 27 November 2006 | RankCorrelSensitivityTornado.jpg (file) |  |
78 KB | Fredbrunt | For tornado plot page | 1 |
| 05:34, 21 November 2006 | Cancel button.bmp (file) |  |
6 KB | Fredbrunt | 1 | |
| 05:04, 21 November 2006 | 5333.ANA (file) | 6 KB | Fredbrunt | 1 | ||
| 04:46, 21 November 2006 | 5361.ana (file) | 1,018 bytes | Fredbrunt | Testing upload of model file | 1 |