Difference between revisions of "Decision tree library"
m (minor updates to reflect new library version) |
|||
| Line 42: | Line 42: | ||
# Enter edit mode by clicking on the cursor icon in the toolbar menu: [[File:ACPT EditMode.png|frameless]] | # Enter edit mode by clicking on the cursor icon in the toolbar menu: [[File:ACPT EditMode.png|frameless]] | ||
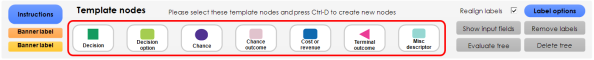
# To add a node to the tree, use the template nodes shown at the top of the model: <br />[[File:DecisionTree templatenodes.png|594x594px]] | # To add a node to the tree, use the template nodes shown at the top of the model: <br />[[File:DecisionTree templatenodes.png|594x594px]] | ||
| − | ## Select the node | + | ## Select the template node you want to use |
| − | |||
| − | |||
## Press Ctrl+D to duplicate the template. | ## Press Ctrl+D to duplicate the template. | ||
## Drag the duplicate to where you want to place it | ## Drag the duplicate to where you want to place it | ||
| Line 50: | Line 48: | ||
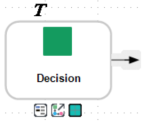
# To add dependency links, draw arrows between nodes. You can do this by hovering over the right edge of a node until you see the arrow icon:<br />[[File:DecisionTree nodehover.png|143x143px]]<br />Hover your cursor over the arrow until it turns into a white arrow, and then click and drag your cursor to the node you want to connect to. Make sure you are connecting to the node (the whole node should be highlighted) and not to a table icon on top of the node. | # To add dependency links, draw arrows between nodes. You can do this by hovering over the right edge of a node until you see the arrow icon:<br />[[File:DecisionTree nodehover.png|143x143px]]<br />Hover your cursor over the arrow until it turns into a white arrow, and then click and drag your cursor to the node you want to connect to. Make sure you are connecting to the node (the whole node should be highlighted) and not to a table icon on top of the node. | ||
# To remove a dependency link, redraw the arrow between the nodes (step 3) to remove it. Note that selecting the arrow and clicking delete or backspace will not properly remove the dependency. | # To remove a dependency link, redraw the arrow between the nodes (step 3) to remove it. Note that selecting the arrow and clicking delete or backspace will not properly remove the dependency. | ||
| − | # For select node types, populate user inputs by clicking this table icon:<br />[[File:EditTableInputIcon.png|26x26px]]<br />Ensure costs and revenues are all in present-value amounts for the same reference year across the whole tree. If you don't see a table icon when you are expecting one, you can add one by clicking on the ''''' | + | # For select node types, populate user inputs by clicking this table icon:<br />[[File:EditTableInputIcon.png|26x26px]]<br />Ensure costs and revenues are all in present-value amounts for the same reference year across the whole tree. If you don't see a table icon when you are expecting one, you can add one by clicking on the '''''Show input fields''''' button in the top right of the library menu. |
# To add custom text labels to your Decision Tree, you can duplicate the yellow and orange banner labels to the left of the template nodes and add them to your tree. | # To add custom text labels to your Decision Tree, you can duplicate the yellow and orange banner labels to the left of the template nodes and add them to your tree. | ||
## Change the background color of banner labels by right clicking on the banner and selecting Show/Hide Color Palette. This should bring up the Color Palette in the upper right corner of your Analytica window. If you select a different color, the selected banner will change to that color. | ## Change the background color of banner labels by right clicking on the banner and selecting Show/Hide Color Palette. This should bring up the Color Palette in the upper right corner of your Analytica window. If you select a different color, the selected banner will change to that color. | ||
| − | # Once you have built your tree, press the ''''' | + | # Once you have built your tree, press the '''''Evaluate tree''''' button to create value and/or probability labels for each node. You can control how the labels display and what information is displayed in the '''''Label options''''' module. You can also decide whether you want the labels to be created as you build the model and if you want labels to be realigned whenever they update using the options in the toolbar. See the '''''Labels options''''' module for more information. |
==Decision tree node labels== | ==Decision tree node labels== | ||
| Line 69: | Line 67: | ||
* whether to append multiple items in a single label vertically or horizontally | * whether to append multiple items in a single label vertically or horizontally | ||
* whether to display input and output item names with their values | * whether to display input and output item names with their values | ||
| + | * whether to color negative and positive EV values red and green | ||
There are also the following options available from the main screen which will affect labels: | There are also the following options available from the main screen which will affect labels: | ||
Revision as of 19:13, 2 January 2025
This library helps you build decision trees in Analytica and calculates the value of each node in your tree.
Download
You can download the Decision tree library here: Decision Tree library.ana
Overview
When you open the library, you will see template nodes and options at the top of the window. Use these to build your decision tree. See Instructions for building a decision tree for specific instructions on how to build the tree and see Decision tree node labels for more information about label options.
The following table provides a brief description of each of the node types in this library.
| Node type | Description |
|---|---|

|
Used for decisions. The value of this node is the maximum value of all downstream decision options. E.g., if a decision has Decision option A worth $1M and Decision option B worth $1.5M, the value of the decision will be $1.5M. |

|
Used for each decision option and must be immediately downstream of a decision node. The user inputs are costs and revenues for the option. The value of this node is the cumulative value of its downstream path including its own costs and revenues. |

|
Used to denote an uncertain outcome or chance. The value of this node is the probability-weighted sum of each downstream chance outcome’s value. |

|
Used for each possible outcome of a chance node and must be immediately downstream of a chance node. The user input is the probability of the outcome. The value of this node is the cumulative value of its downstream path. |

|
Used to add cost or revenue to a path. The user inputs are costs and revenues. The value of this node is the cumulative value of its downstream path including its own costs and revenues. |

|
The final node in a path. This is the only node that can have more than one upstream node(i.e. more than one upstream arrow), but only when all paths leading to this node have equal value. The user inputs are costs and revenues. The value of this node is the cumulative value of the entire path, including its own costs and revenues. |

|
Used to add a miscellaneous descriptor to a path, but does not change the value of the path. |

|
Used to add labels to the diagram, such as timeline or milestone markers. |
Instructions for building a decision tree
- Enter edit mode by clicking on the cursor icon in the toolbar menu:

- To add a node to the tree, use the template nodes shown at the top of the model:
- Select the template node you want to use
- Press Ctrl+D to duplicate the template.
- Drag the duplicate to where you want to place it
- To rename the node: click on the node, then click on the node title, and enter a new title.
- To add dependency links, draw arrows between nodes. You can do this by hovering over the right edge of a node until you see the arrow icon:
Hover your cursor over the arrow until it turns into a white arrow, and then click and drag your cursor to the node you want to connect to. Make sure you are connecting to the node (the whole node should be highlighted) and not to a table icon on top of the node. - To remove a dependency link, redraw the arrow between the nodes (step 3) to remove it. Note that selecting the arrow and clicking delete or backspace will not properly remove the dependency.
- For select node types, populate user inputs by clicking this table icon:

Ensure costs and revenues are all in present-value amounts for the same reference year across the whole tree. If you don't see a table icon when you are expecting one, you can add one by clicking on the Show input fields button in the top right of the library menu. - To add custom text labels to your Decision Tree, you can duplicate the yellow and orange banner labels to the left of the template nodes and add them to your tree.
- Change the background color of banner labels by right clicking on the banner and selecting Show/Hide Color Palette. This should bring up the Color Palette in the upper right corner of your Analytica window. If you select a different color, the selected banner will change to that color.
- Once you have built your tree, press the Evaluate tree button to create value and/or probability labels for each node. You can control how the labels display and what information is displayed in the Label options module. You can also decide whether you want the labels to be created as you build the model and if you want labels to be realigned whenever they update using the options in the toolbar. See the Labels options module for more information.


Decision tree node labels
On the right hand side of the template menu there are some label options:

Open the Label options module to control specific label options, such as:
- label and node font and font size
- label number and currency formatting
- which inputs and outputs are displayed
- where inputs and outputs are positioned relative to their parent node
- whether to display 0 values in labels
- whether to append multiple items in a single label vertically or horizontally
- whether to display input and output item names with their values
- whether to color negative and positive EV values red and green
There are also the following options available from the main screen which will affect labels:
| Option | Description |
|---|---|
| Removes all labels, making it easy to reorganize the placement of nodes. | |
| Updates the labels, such that new labels are created for missing or deleted labels. | |
| Controls whether labels are realigned to their parent nodes when updated. Uncheck to maintain your custom placement of labels. | |
| Controls whether labels are created as nodes are added to the tree. |
Example models
- Decision Tree party problem.ana: This example model takes the party problem from the Tutorial: Decision trees chapter and uses the Decision tree library to create a decision tree of the same problem.
Enable comment auto-refresher