Difference between revisions of "F. Viewing results of an array calculation"
| (2 intermediate revisions by the same user not shown) | |||
| Line 1: | Line 1: | ||
| + | [[Category: Arrays]] | ||
| + | |||
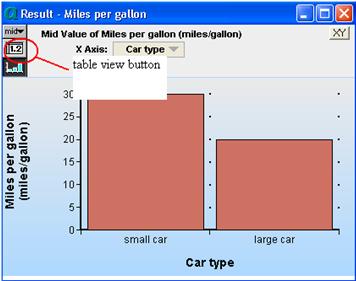
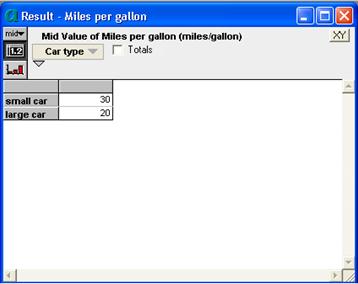
1. Click on the ‘result button’. A result button should come up. Click ‘table view’ button. | 1. Click on the ‘result button’. A result button should come up. Click ‘table view’ button. | ||
| − | [[Image:Table Mpg.jpg]] | + | :[[Image:Table Mpg.jpg]] |
<br> | <br> | ||
| − | [[Image:Result Mpg.jpg]] | + | :[[Image:Result Mpg.jpg]] |
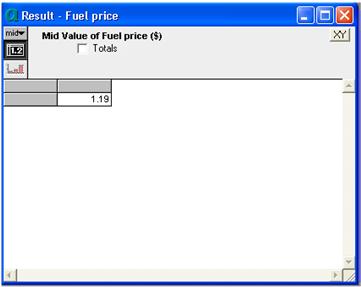
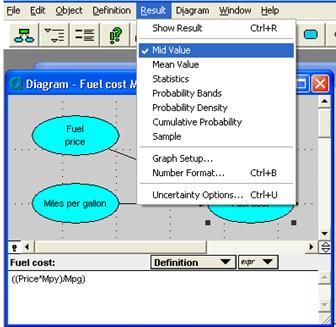
| − | 2. Click on the diagram button to return to diagram window. Select | + | 2. Click on the diagram button to return to diagram window. Select <code>fuel price</code> node. Select ‘mid value’ from the [[Result menu]]. [[Result window]] should appear. |
<br> | <br> | ||
| − | [[Image:Mid value.jpg]] | + | :[[Image:Mid value.jpg]] |
<br> | <br> | ||
| − | [[Image:Result Fuel Price.jpg]] | + | :[[Image:Result Fuel Price.jpg]] |
| − | 3. Click ‘diagram button’ to return to diagram window. Select | + | 3. Click ‘diagram button’ to return to diagram window. Select <code>miles per year</code> node. Click the ‘result’ button from the menu items. [[Result window]] should appear. |
<br> | <br> | ||
| − | [[Image:Result Mpy.jpg]] | + | :[[Image:Result Mpy.jpg]] |
| − | 4. Select | + | 4. Select <code>fuel cost</code> node. Select ‘mid value’ from the [[Result menu]] items. |
<br> | <br> | ||
| − | [[Image:Mid value Fuel Cost.jpg]] | + | :[[Image:Mid value Fuel Cost.jpg]] |
5. A ‘Result window’ should come up. Click ‘table view button’ | 5. A ‘Result window’ should come up. Click ‘table view button’ | ||
<br> | <br> | ||
| − | [[Image:Result Fuel Cost.jpg]] | + | :[[Image:Result Fuel Cost.jpg]] |
| − | 6. Close ‘Result’ window. Click on the ‘Diagram’ button to return to | + | 6. Close ‘Result’ window. Click on the ‘Diagram’ button to return to <code>car cost</code> window. |
| − | 7. Select | + | 7. Select <code>Maintenance cost</code> node. Click ‘result’ button. A graph result window should appear. Click ‘table’ button. Diagram should change to table window. |
<br> | <br> | ||
| − | [[Image:Result Maintenance cost.jpg]] | + | :[[Image:Result Maintenance cost.jpg]] |
| − | 8. Click on the ‘Diagram’ button. Select | + | 8. Click on the ‘Diagram’ button. Select <code>Total cost</code>. Click ‘key icon’ to open attribute panel. Click on the ‘Attributes popup menu’. Select ‘Definition’. |
<br> | <br> | ||
| − | [[Image:Total Cost attribute.jpg]] | + | :[[Image:Total Cost attribute.jpg]] |
9. Select ‘mid value’ from the Result menu. | 9. Select ‘mid value’ from the Result menu. | ||
<br> | <br> | ||
| − | [[Image:Result total cost1.1.jpg]] | + | :[[Image:Result total cost1.1.jpg]] |
| + | |||
| + | ==See Also== | ||
| + | * [[Diagram window]] | ||
| + | * [[Result window]] | ||
| + | * [[Table view of a result]] | ||
Latest revision as of 23:23, 24 May 2016
1. Click on the ‘result button’. A result button should come up. Click ‘table view’ button.
2. Click on the diagram button to return to diagram window. Select fuel price node. Select ‘mid value’ from the Result menu. Result window should appear.
3. Click ‘diagram button’ to return to diagram window. Select miles per year node. Click the ‘result’ button from the menu items. Result window should appear.
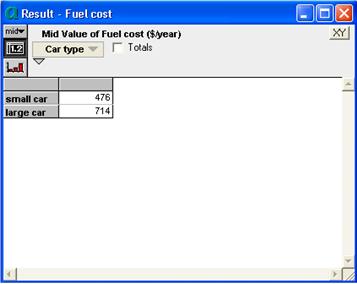
4. Select fuel cost node. Select ‘mid value’ from the Result menu items.
5. A ‘Result window’ should come up. Click ‘table view button’
6. Close ‘Result’ window. Click on the ‘Diagram’ button to return to car cost window.
7. Select Maintenance cost node. Click ‘result’ button. A graph result window should appear. Click ‘table’ button. Diagram should change to table window.
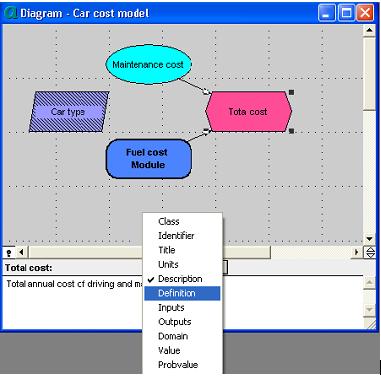
8. Click on the ‘Diagram’ button. Select Total cost. Click ‘key icon’ to open attribute panel. Click on the ‘Attributes popup menu’. Select ‘Definition’.
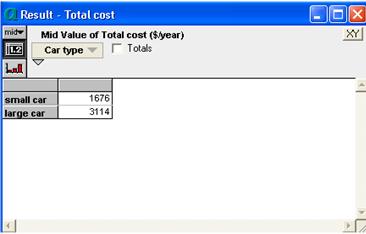
9. Select ‘mid value’ from the Result menu.



Enable comment auto-refresher