Difference between revisions of "Frame node"
m |
|||
| Line 1: | Line 1: | ||
''(New to [[Analytica 6.0]])'' | ''(New to [[Analytica 6.0]])'' | ||
| + | == Basic functionality == | ||
A frame node is a component that is used for creating dashboards, especially in model user interfaces that are designed to be used on the Web from [[ACP]]. The frame node displays an edit table, result table, or result graph, and changes what is displayed as the user interacts with the model's UI. When you click the edit table button for a [[User input node]] that appears on the same diagram, the edit table appears in the frame node. When you click a result button for a [[User output node]], the corresponding result table or graph appears in the frame node, replacing the previous content. | A frame node is a component that is used for creating dashboards, especially in model user interfaces that are designed to be used on the Web from [[ACP]]. The frame node displays an edit table, result table, or result graph, and changes what is displayed as the user interacts with the model's UI. When you click the edit table button for a [[User input node]] that appears on the same diagram, the edit table appears in the frame node. When you click a result button for a [[User output node]], the corresponding result table or graph appears in the frame node, replacing the previous content. | ||
Revision as of 17:49, 20 April 2021
(New to Analytica 6.0)
Basic functionality
A frame node is a component that is used for creating dashboards, especially in model user interfaces that are designed to be used on the Web from ACP. The frame node displays an edit table, result table, or result graph, and changes what is displayed as the user interacts with the model's UI. When you click the edit table button for a User input node that appears on the same diagram, the edit table appears in the frame node. When you click a result button for a User output node, the corresponding result table or graph appears in the frame node, replacing the previous content.
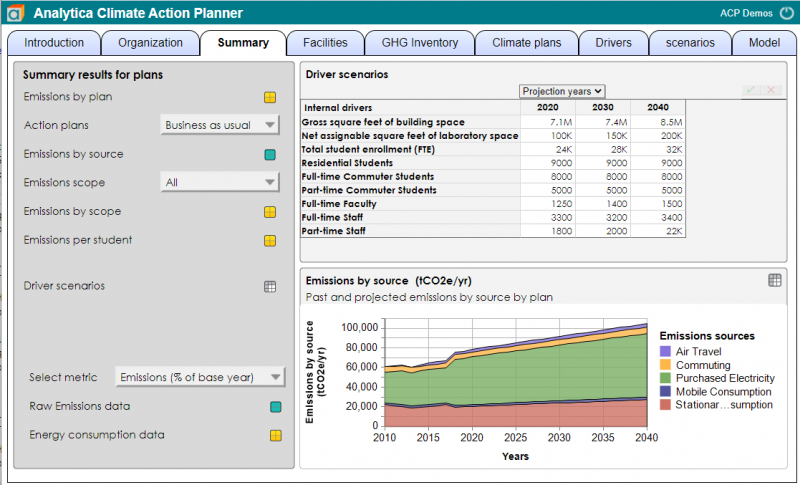
A common UI layout that is used with frame nodes is to have the user inputs and user outputs aligned along the left edge of the diagram, with the frame node on the right, as illustrated here:
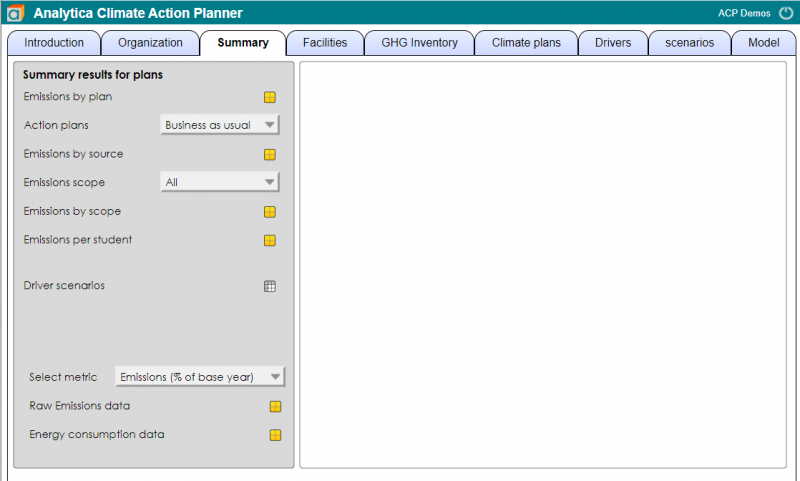
In this example, the button style in the Diagram Style dialog is set to Icon, so a calc button appears as ![]() instead of
instead of ![]() , etc. When you press the calc button for Emissions by plan, the result graph for that variable appears in the frame node.
, etc. When you press the calc button for Emissions by plan, the result graph for that variable appears in the frame node.
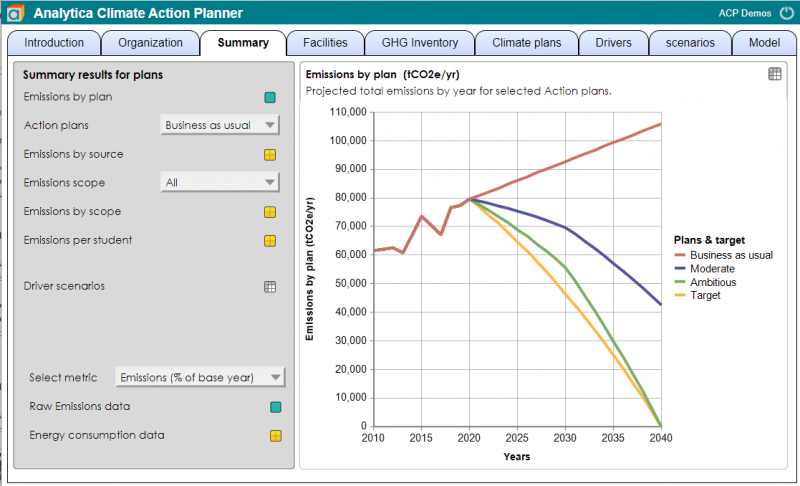
When you then click the edit table button for Driver scenarios, its edit table appears in the frame node.
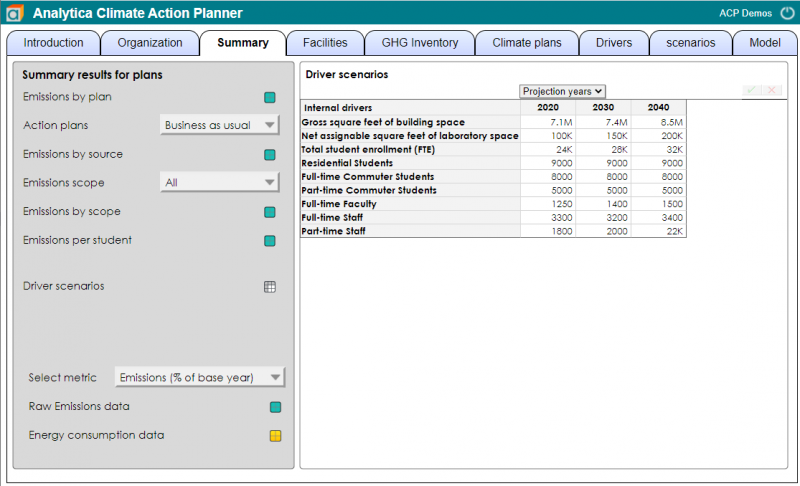
At each step, the frame node displays the most recently selected edit table or result. By reusing screen real estate in this way, it makes for a favorable user experience, especially when using a model in a web browser via ACP.
Two or more frame nodes
When you place two (or more) frame nodes on the same diagram, as shown here
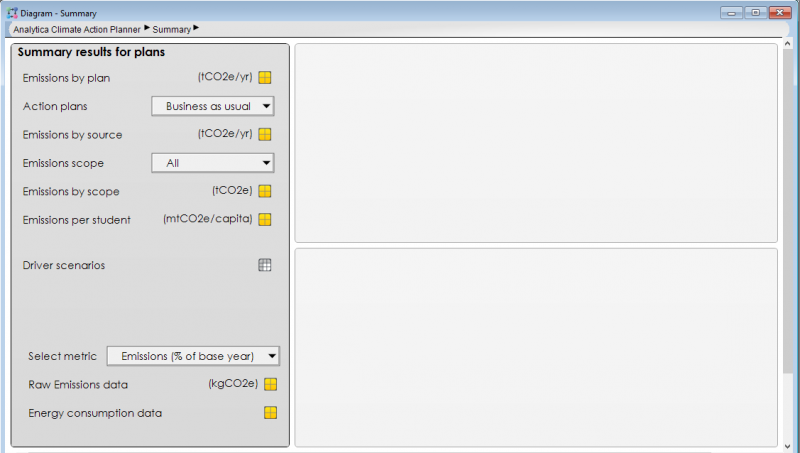
then the content alternates between them as you press input or output buttons.
Creating a Frame node
To create a frame node (in desktop Analytica), first drag a text node to the diagram, then change its class to Frame node. You can do this in the Object window for the frame node
or in the attribute pane with the frame node selected
After creating the node, make sure you resize it to be large enough to hold tables and graphs.
You'll also need to include some User input nodes or User output nodes on the same diagram, so that the user can select content.
Once you've created the frame node(s), the content will automatically appear in the frame node when you play your model in ACP. In desktop Analytica (as of Analytica 6.0), the content does not appear directly in the frame node by default, but edit table or result windows open directly over the frame node, which roughly simulates the ACP experience.
Side note: In desktop Analytica, the emded bit of the NodeInfo attribute controls whether content appears directly in frame nodes (as it also does in tall User input nodes and tall User output nodes). This bit is off by default in Analytica 6.0 due to the fact that the feature is still glitchy with some missing functionality in desktop Analytica. To turn on direct embedding in desktop Analytica, set the 11th field (the embed bit) or NodeInfo for the frame node object (if you want this to apply only to the one frame node), or in the NodeInfo for the FrameNode class object (if you want it to apply to all frame nodes in the model). To do this, open the Typescript window and view the current value:
- >
NodeInfo of FrameNode 1,0,0,0,,,,,,,,,0
Then copy that value, changing the 11th field to 1:
- >
NodeInfo of FrameNode : 1,0,0,0,,,,,,,1,,0
This will alter the behavior in desktop Analytica, but not in ACP. If you find this to be too glitchy with the current Analytica release, reset the attribute to its original value (i.e., clear the 11th field).
Scripting a Frame Node
An attribute of a frame node determines what is currently displayed in the frame node. This attribute is named Att_FrameNodeShowing. The value should either be unset (i.e., nothing displayed in the frame), or must be a 1-D array indexed by a special system index named Sys_FrameNodeShowIdx. The 1-D array has 4 elements, as follows:
- «obj»: A handle to the variable shown.
- «view»: Which view is shown. Possible values are:
'DFNM': Show edit table'DEFA': Show the default result view (as saved with result window)'MIDM': Show the mid-value'MEAN': Show the mean'STAT': Show the statistics view'CONF': Show the probability bands'CDFP': Show the cumulative probability view'PDFP': Show the probability density or probability mass view'XCDZ': Show the exceedance probability view'SAMP': Show the sample view'SMPL': Show the sample view, even if if is non-probabilistic'OBJV': Show the object window view. This case is not currently available in desktop Analytica.'DIAG': Show the diagram (in which case, «obj» should be a handle to a module). This case is not yet fully functional in ACP and isn't available in desktop Analytica.
- «graph»: Set to 1 to display a graph result view, 0 for table. Ignored for edit tables, object views or diagrams. Null to use saved result window state.
- «computed»: 1 when result has already been computed (or results in an error), 0 when not yet computed, Null when state is not relevant or unknown. When setting from an event handler, you will usually set this to Null.
Using this attribute, you can change what is displayed from within OnClick code (e.g., in a button), OnChange code (e.g., in a Choice input]]) or OnGraphClick code (e.g., drill down by selecting a datum in a graph). You can even set it to show a result for a variable that does not appear in the same diagram.
An example of code that might appear in an OnClick event, to show the result PDF graph for the variable Net_emissions would be:
Att_FrameNodeShowing of MyFrameNode: Array( Sys_FrameNodeShowIdx,[ Handle(Net_emissions), 'PDFP', 1, Null ])
In a Choice node, where each selection is a handle to an input table, you could select which table you are currently editing by setting its OnChange expression to
Att_FrameNodeShowing of MyFrameNode: Array( Sys_FrameNodeShowIdx,[ Self, 'DFNM', Null, Null ] )


Enable comment auto-refresher