Graphing a Probability Density
Graphing the probability density or cumulative probability density of an uncertain variable is easy in Analytica. You need only select Probability Density or Cumulative Probability from the Result menu, or from the result mode dropdown at the top-left corner of a result window. In these cases, Analytica's GUI automatically knows how to show statistical results when the computed result is a sample indexed by Run.
However, if you compute a PDF or CDF histogram yourself, you end up with a 2-D array of histogram points. To plot this as a histogram, you set up a coordinate index. This mini-tutorial walks you through the steps.
Setting up the Data
Let's begin by computing some histograph data.
1. Start Analytica. In the model object window, title the model "Plotting Histogram Data". Then close the object window.
2. On the diagram, create a chance node, Ch1, and set its definition to
Pdf(Gamma(10))
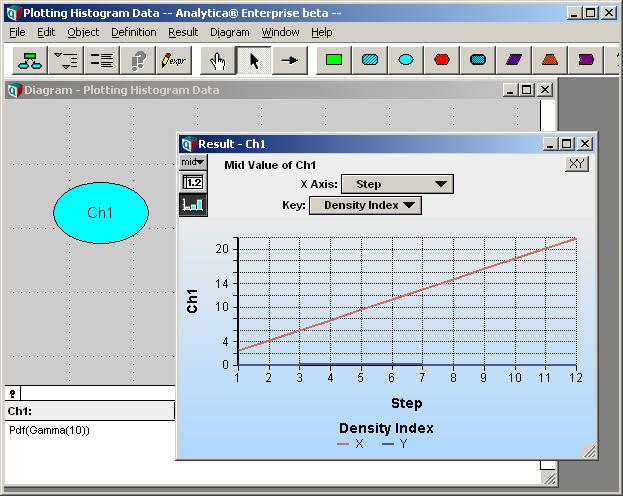
That doesn't look like the PDF of a gamma distribution, does it? In this graph, the bin coordinates (X) are being plotted as one series, and the density values (Y) as a second series. To plot the PDF, we need to plot X versus Y, rather than plotting X and Y as separate series.
Before doing this, let's examine how the underlying data is organized.
4. Switch to table view, i.e., press the ![]() button in the graph window. For easier viewing, pivot the table so that the Step index forms the rows, the DensityIndex the columns.
button in the graph window. For easier viewing, pivot the table so that the Step index forms the rows, the DensityIndex the columns.
The values that we wish to plot on the X-values are stored in the first column of the data. The values we wish to plot on the Y-axis are in the second column. Hence, the Step index dimensions a set of 2-D data points. Each row of this table represents one point having an (X,Y) coordinate given by the two column values.
To use each row as a coordinate, we must tell Analytica to use the DensityIndex as the coordinate index (i.e., the index that dimensions the coordinates of each point).
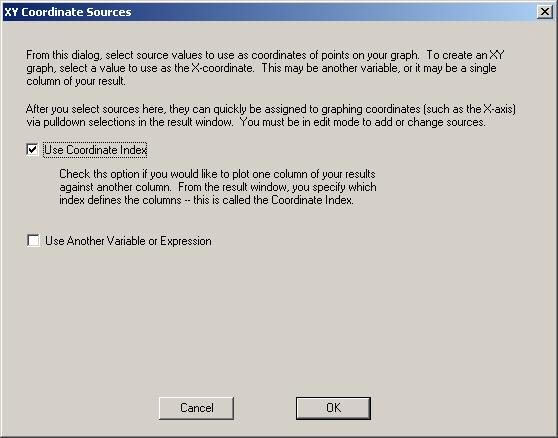
5. Press the ![]() at the top-left corner of the result window. Select "Use Coordinate Index".
at the top-left corner of the result window. Select "Use Coordinate Index".
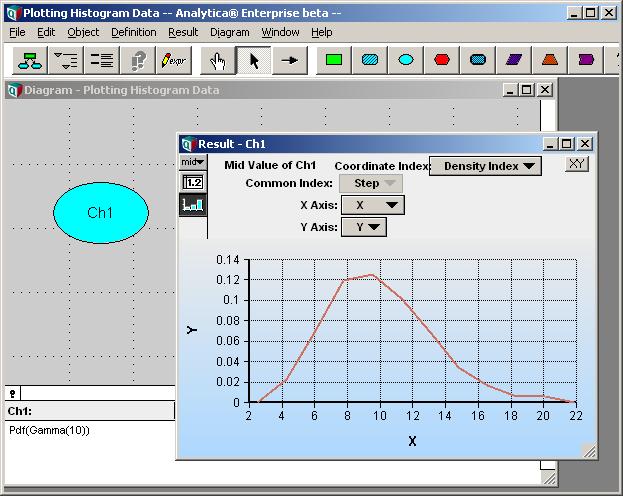
6. Finally, graph the data by pressing ![]() , and we have the desired density graph.
, and we have the desired density graph.


Enable comment auto-refresher