Defining the fox population as a function of time
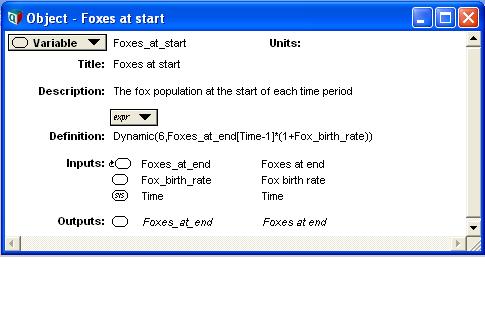
- Double click ‘Foxes at start’ node.
Expected: Object window should appear.
- In the Description field type ‘The fox population at the start of each time period’.
Expression Assist
Use the Expression assist to set the definition:= Dynamic(6,Foxes_at_end[Time-1]*(1+Fox_birth_rate))
- Select definition
- Enter 'D
Expected: the expression assist offers possible entries starting with D
- Enter 'y'
Expected: The list truncates to only include those starting with DY
- Use the down arrow to select Dynamic and tab to select it
Expected: Dynamic( in the definition
- Enter 6,
Expected, Expressions Assist moves to the next parameter.
- Continue using the expression assist to enter the definition as depicted.
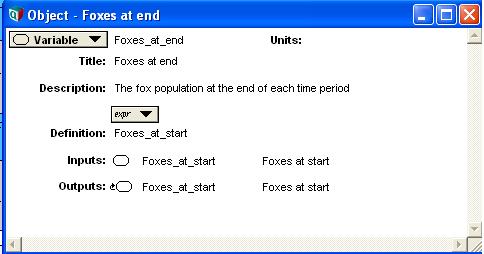
- Double click ‘Foxes at end’.
Expected: Object window should appear.
- . Type ‘The fox population at the end of each time period’ in the Description field.
- Click the Definition field. Click ‘Inputs’ popup menu button, select ‘Foxes_at_start’.
- ‘Foxes_at_start’ should appear on the Definition field. Click on the check button to accept your entry. Click on the diagram button.
- With the Foxes at end node selected, click on the result button. Result window should appear.
See Also
Comments


Enable comment auto-refresher