Creating a model based on chapter 4 of tutorial
Creating variables
Drawing an arrow between nodes
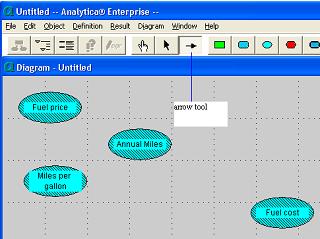
- a. Select the arrow tool from the tool palette. You should notice a change in your cursor until you click anywhere in the diagram.
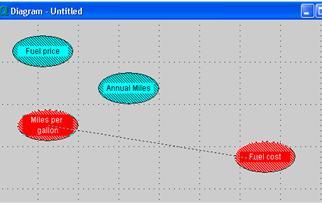
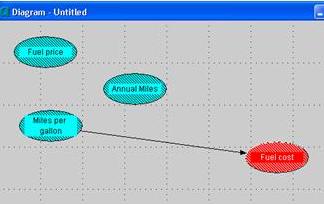
- b. Click on ‘Miles per gallon’ drag the arrow to ‘Fuel cost’. A broken line should appear from ‘Miles per gallon’ node to ‘Fuel cost’ node. Release the mouse. An arrow should appear from one node to another.
Deleting arrow
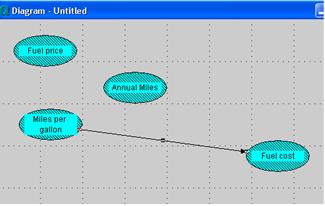
- a. Click on the arrow. Arrow should become selected. You can tell the arrow is selected because there are three small square (a.k.a. ‘handles’) at the start, middle and end of the arrow.. Press ‘delete’. The arrow should disappear.
Connecting multiple arrows
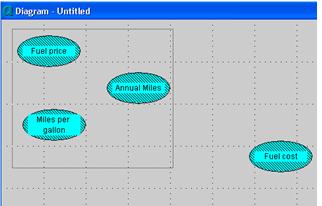
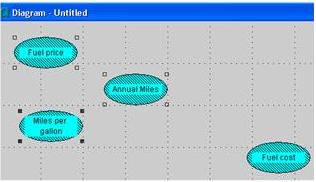
- a. Select all three nodes at one time by clicking on the top left corner of the ‘Fuel price’ node, holding the mouse button down and drag the cursor to create an imaginary box that house the 3 nodes. Release the mouse. All 3 nodes should be selected.
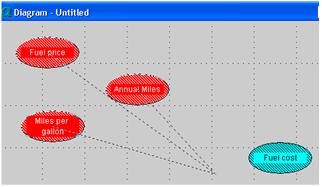
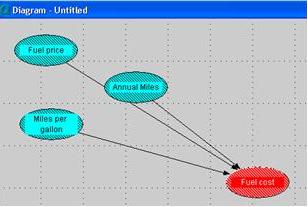
- b. Select ‘arrow tool’. Place the mouse’s cursor over any of the 3 selected nodes. Press down on the mouse and drag the cursor cursor over to the ‘fuel cost’ node and then release the mouse button. A broken line should appear. Three arrows should point to ‘Fuel cost’ node.
- c. Click anywhere on the influence diagram’s background. The ‘Fuel cost’ node should beceome deselected.
- d. Select edit button to turn off arrow drawing.
Comments
Enable comment auto-refresher