Defining the population control: foxes capture hares
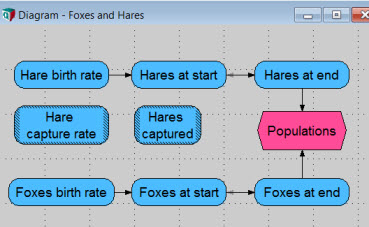
1. Drag two variable nodes in the diagram, type ‘Hare capture rate’ and ‘Hares captured’ for the title.
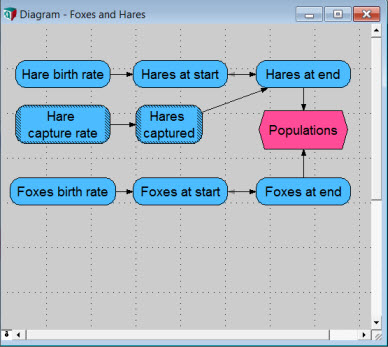
2. Create an arrow from ‘Hare capture rate’ to ‘Hares captured’, then from ‘Hares captured’ to ‘Hares at end’.
3. Double click on Hare capture rate to open its object window. Object window should appear.
4. In the Description field type ‘Percentage of hares captured by each fox during a time period. Press tab.
5. In the Definition field type ‘25%’, press alt+enter. Your object window should look like this.
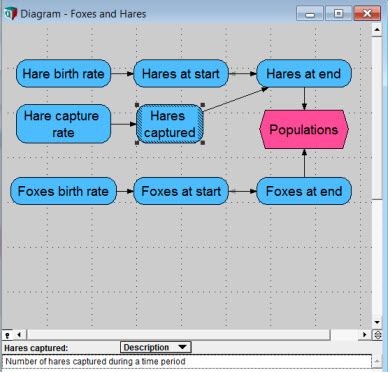
6. Select Hares captured. Click on the key icon. Select Description from the Attribute popup menu. Type ‘Number of hares captured during a time period’.
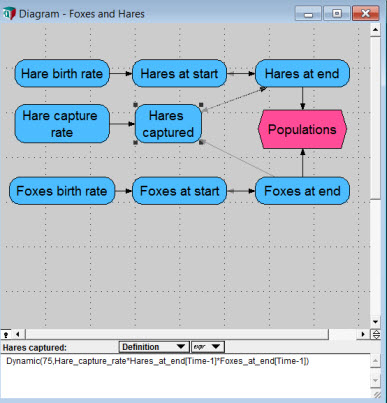
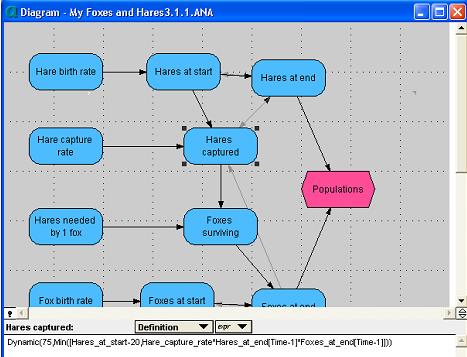
7. Draw arrows from both ‘Hares at end’ and ‘Foxes at end’ to ‘Hares captured’. Your diagram should look like this.
8. Select Hares captured. Click on the key icon. Select Definition from the Attribute popup menu, type Dynamic(75,Hare_capture_rate*Hares_at_end[Time-1]*Foxes_at_end[Time-1]). Press alt+enter.
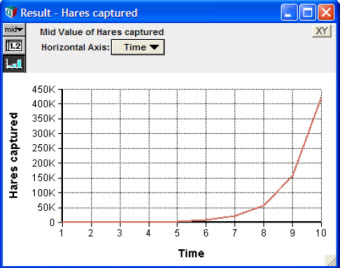
9. Click on the result button. Result window should appear.
10. Close the Result window. Hares captured still selected open its attribute panel. In the Attribute popup menu select Definition. Type Dynamic(75,Min([Hares_at_start-20,Hare_capture_rate*Hares_at_end[Time-1]*Foxes_at_end[Time-1]-20]))
11. Press alt+enter to accept the changes.
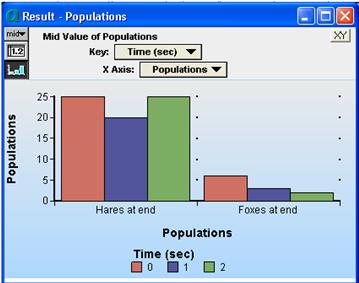
12. Select Populations. Click on the Result button. Return to Diagram window.


Enable comment auto-refresher