Creating the Foxes and Hares diagram
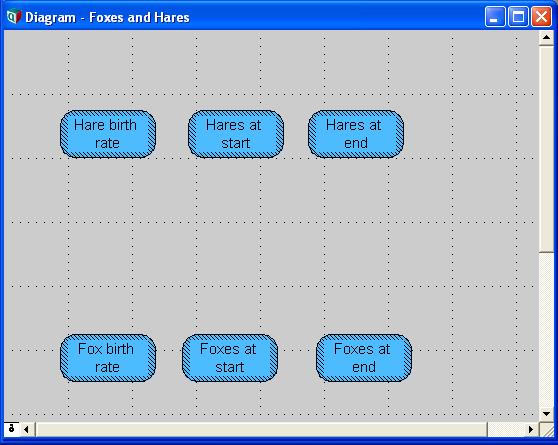
1. From the button menu, drag 6 variable nodes in the diagram. Arrange it in two rows. Type ‘Hare birthrate, Hares at start, Hares at end, Fox birthrate, Foxes at start, and Foxes at end’ respectively for its title.
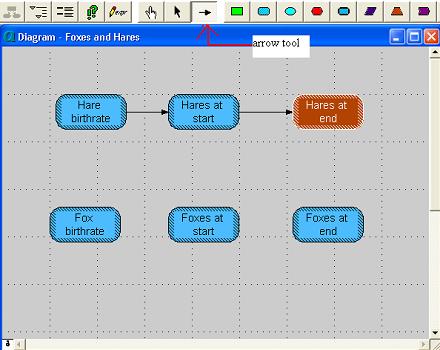
2. Click on the arrow tool. Draw arrow from ‘Hare birthrate to Hares at start’, and ‘Hares at start to Hares at end’. Repeat the step on the second set of variable node.
Comments


Enable comment auto-refresher