F. Viewing results of an array calculation
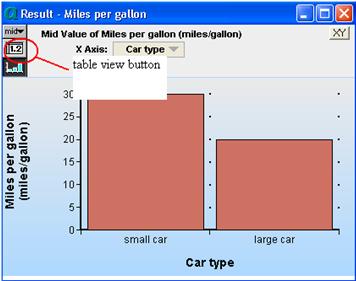
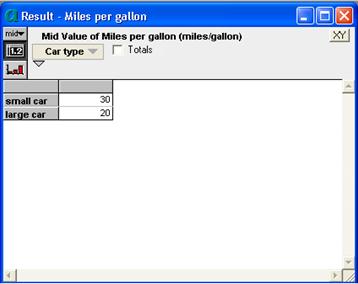
1. Click on the ‘result button’. A result button should come up. Click ‘table view’ button.
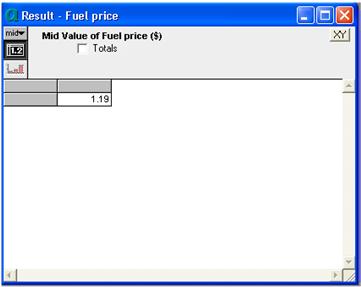
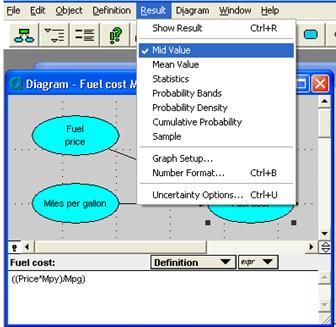
2. Click on the diagram button to return to diagram window. Select ‘fuel price’ node. Select ‘mid value’ from the ‘Result menu’. Result window should appear.
3. Click ‘diagram button’ to return to diagram window. Select ‘miles per year’ node. Click the ‘result’ button from the menu items. Result window should appear.
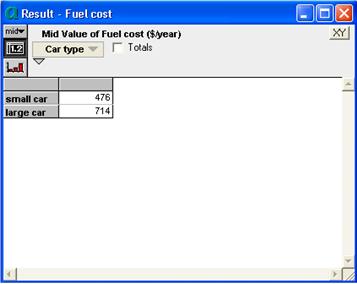
4. Select ‘fuel cost’ node. Select ‘mid value’ from the Result menu items.
5. A ‘Result window’ should come up. Click ‘table view button’
6. Close ‘Result’ window. Click on the ‘Diagram’ button to return to ‘car cost’ window.
7. Select ‘Maintenance cost’ node. Click ‘result’ button. A graph result window should appear. Click ‘table’ button. Diagram should change to table window.
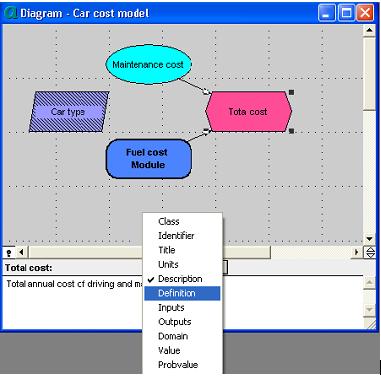
8. Click on the ‘Diagram’ button. Select ‘Total cost’. Click ‘key icon’ to open attribute panel. Click on the ‘Attributes popup menu’. Select ‘Definition’.
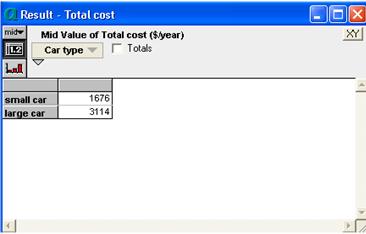
9. Select ‘mid value’ from the Result menu.



Enable comment auto-refresher