Creating Arrays (Tables)
E. Creating another array using the same index
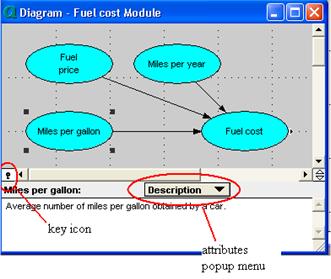
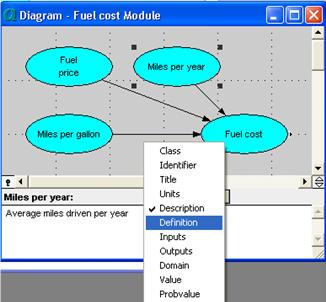
1. Double click on ‘Fuel cost’ module to open the diagram inside. Click the key icon to open the attribute panel. Select ‘miles per gallon’. Select ‘Definition’ from the attributes pop up menu.
2. Select table from the expr popup menu. Question box should appear. Click ‘ok’.
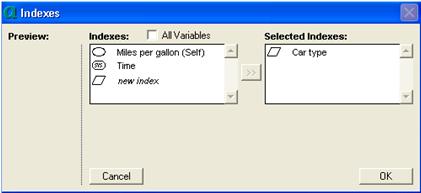
3. Select ‘car type’. Click >> arrow. Click ‘ok’. An edit table should come up.
4. Select the first cell. Type ‘Uniform (25,35)’. Press arrow down key. Type ‘Uniform(15,25)’. Click the check button.
F. Viewing results of an array calculation
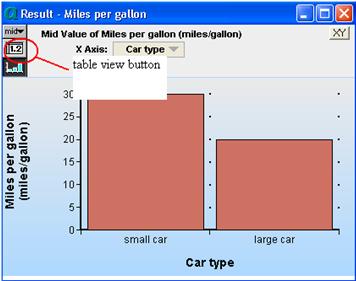
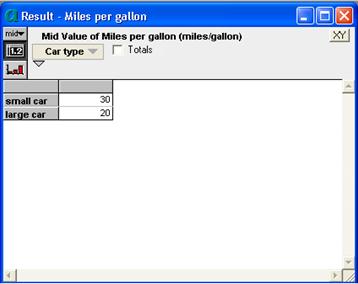
1. Click on the ‘result button’. A result button should come up. Click ‘table view’ button.
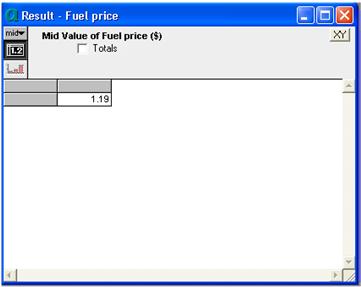
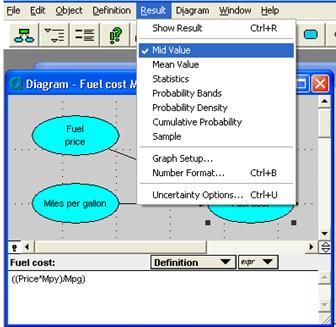
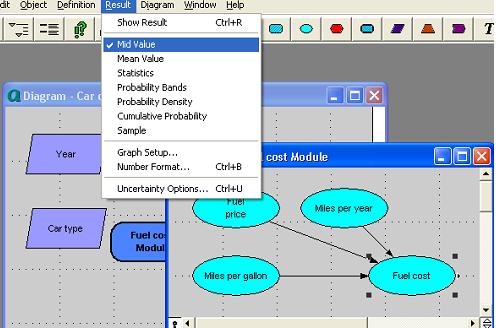
2. Click on the diagram button to return to diagram window. Select ‘fuel price’ node. Select ‘mid value’ from the ‘Result menu’. Result window should appear.
3. Click ‘diagram button’ to return to diagram window. Select ‘miles per year’ node. Click the ‘result’ button from the menu items. Result window should appear.
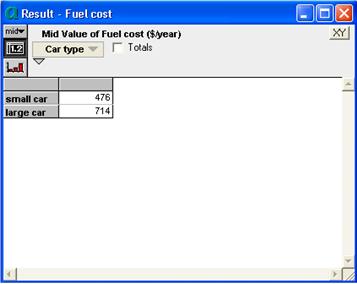
4. Select ‘fuel cost’ node. Select ‘mid value’ from the Result menu items.
5. A ‘Result window’ should come up. Click ‘table view button’
6. Close ‘Result’ window. Click on the ‘Diagram’ button to return to ‘car cost’ window.
7. Select ‘Maintenance cost’ node. Click ‘result’ button. A graph result window should appear. Click ‘table’ button. Diagram should change to table window.
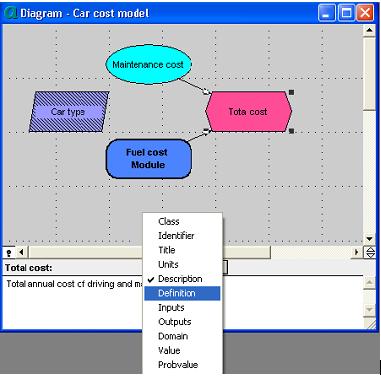
8. Click on the ‘Diagram’ button. Select ‘Total cost’. Click ‘key icon’ to open attribute panel. Click on the ‘Attributes popup menu’. Select ‘Definition’.
9. Select ‘mid value’ from the Result menu.
F. Combining results from a table
1. Click at the left side of the definition field, type Sum(. Click at the end of definition field, type ,Car_type). Click the check button to accept the definition.
2. Click ‘Result’ button.
3. Close the Result window.
G. Adding a dimension to a variable
1. Drag an index node, drop it a few inches on top of ‘car type’ index node. Type ‘Year’
2. Click on the key icon. Select ‘Description’ from the attribute popup menu.
3. Type ‘Year of ownership’, press alt+enter. Select ‘Definition’ from the popup menu.
4. Select ‘List’ from the expr popup menu. First cell is entered as 1, press Enter key twice to have 3 cells with appropriate nos.
5. Select ‘Maintenance cost’.
6. Click on the ‘Edit table’ button. Edit table window should come up. Click on the ‘index’ icon.
7. Select ‘Year’ in the index lists. Click arrow >>, then press ‘ok’.
8. Click on the 2nd column change units to ‘1500’ press arrow down key, type ‘2600’. Click on the 3rd column, enter ‘1700’ press arrow down key, enter ‘3000’. Click the check button.
H. Completing the model
1. Click icon button. Select ‘Definition’ from array popup menu. Click expr button, select table.
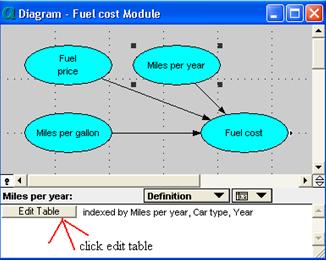
2. Click ‘Edit Table’ button. Edit table window should come up.
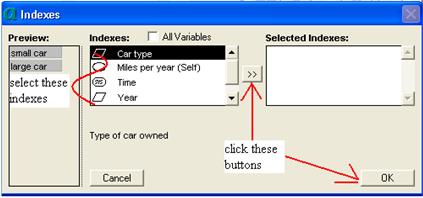
3. Click the ‘index’ icon. Indexes window should appear. Select ‘Car Type’, click >>. Repeat the same procedure for ‘Year’. Click ‘ok’ button.
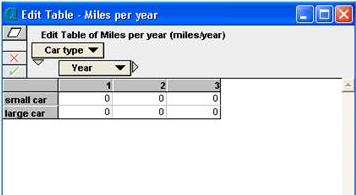
4. Edit table should appear, zero is entered by default .
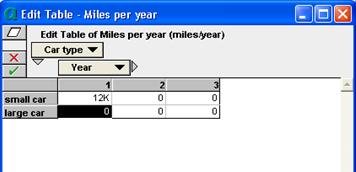
5. Select the 1st column. Enter ‘12K’. Press arrow down key. Enter ‘12K’.
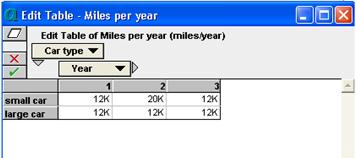
6. Select 2nd column, enter ‘20K’ press arrow down key enter ‘12K’. Repeat the same for the 3rd column, enter ‘12K’ for the 1st and 2nd row.
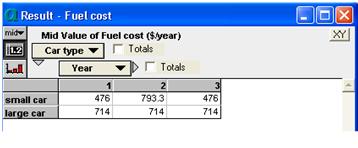
7. Select ‘fuel cost’. Click ‘Result’ from the menu items, select ‘mid value’. Result table window should appear.
8. Examine mid value of fuel cost.
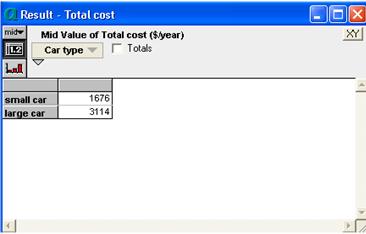
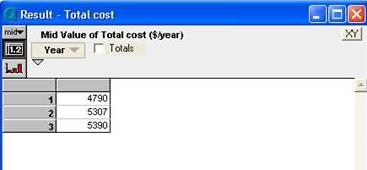
9. Click diagram button to return to parent diagram. Select ‘Total cost’. Click the result button to examine the mid value.







Enable comment auto-refresher