Frame node
(New to Analytica 6.0)
A frame node is a component that is used for creating dashboards, especially in model user interfaces that are designed to be used on the Web from ACP. The frame node displays an edit table, result table, or result graph, and changes what is displayed as the user interacts with the model's UI. When you click the edit table button for a User Input node that appears on the same diagram, the edit table appears in the frame node. When you click a result button for a User output node, the corresponding result table or graph appears in the frame node, replacing the previous content.
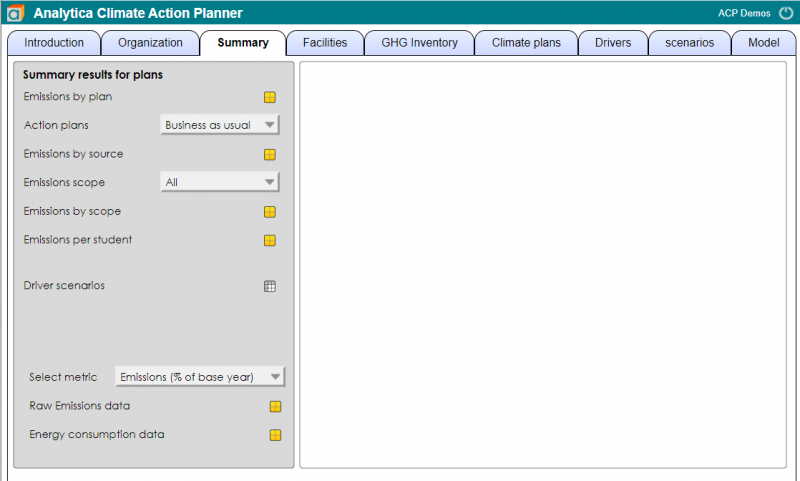
A common UI layout that is used with frame nodes is to have the user inputs and user outputs aligned along the left edge of the diagram, with the frame node on the right, as illustrated here:

In this example, the button style in the Diagram Style dialog is set to Icon, so a calc button appears as ![]() instead of
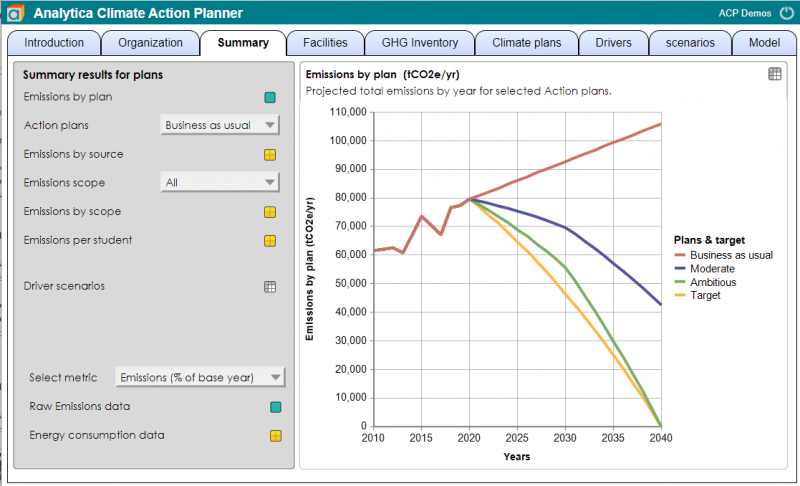
instead of ![]() , etc. When you press the calc button for Emissions by plan, the result graph for that variable appears in the frame node.
, etc. When you press the calc button for Emissions by plan, the result graph for that variable appears in the frame node.

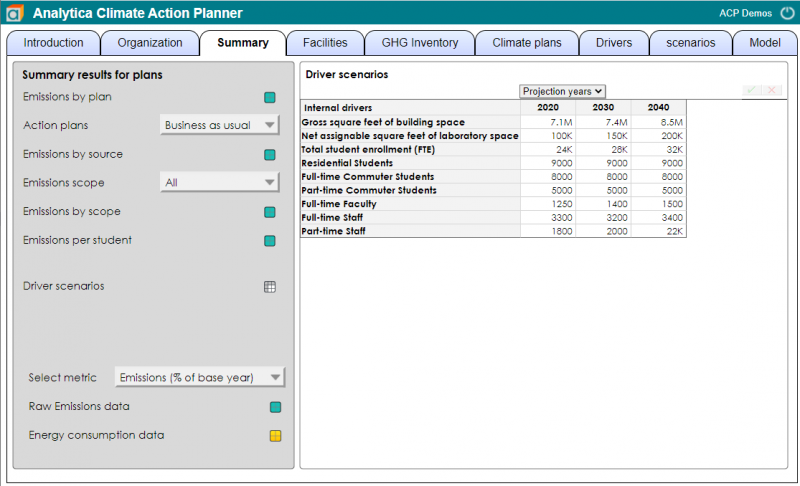
When you then click the edit table button for Driver scenarios, its edit table appears in the frame node.

Enable comment auto-refresher