|
Menu item
|
Description
|
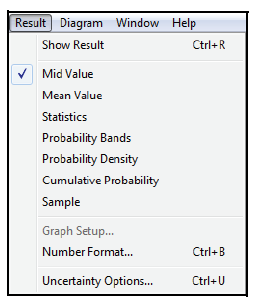
| Show Result
|
Opens a Result window for the selected object. See “The Result window” on page 26.
|
| Mid Value
|
Displays the mid or deterministic value. See “Uncertainty views” on page 29.
|
| Mean Value
|
Displays the mean of the uncertain value. See “Uncertainty views” on page 29.
|
| Statistics
|
Displays statistics of the uncertain value in a table as set in the Uncertainty Setup dialog. See “Uncertainty views” on page 29.
|
| Probability Bands
|
Shows probability bands (percentiles) as set in the Uncertainty Setup dialog. See “Uncertainty views” on page 29.
|
| Probability Density
|
Displays a probability density graph for an uncertain value. For a discrete probability distribution, Probability Mass replaces this command. See “Uncertainty views” on page 29.
|
| Cumulative Probability
|
Displays a cumulative probability graph representing the probability that a variable’s value is less than or equal to each possible (uncertain) value. See “Uncertainty views” on page 29.
|
| Sample
|
Displays a table of the values determined for each uncertainty sample iteration. See “Uncertainty views” on page 29.
|
| Graph Setup
|
Displays a dialog to specify the graphing tool, graph frame, and graph style. See “Graphing roles” on page 83.
|
| Number Format
|
Displays a dialog to set the number format for displays of results. See “Number formats” on page 78.
|
| Uncertainty Options
|
Displays a dialog to specify the uncertainty sample size and sampling method and to set options for statistics, probability bands, probability density, and cumulative probability. See “Uncertainty Setup dialog” on page 257.
|
Enable comment auto-refresher