Import and Export data
Using the Import and Export Commands
Importing into an Edit Table or List
To import a definition from a text file into an edit table or list:
- Select the definition field of the variable in either the Object window or Attribute panel definition view. If variable is a table, open the edit table.
- If you are importing a simple tab-delimited file, then select the cell(s) in which to import. If you are importing a data file in the format described in “Default and XML model file formats” on page 344, then the cell selection is not used.
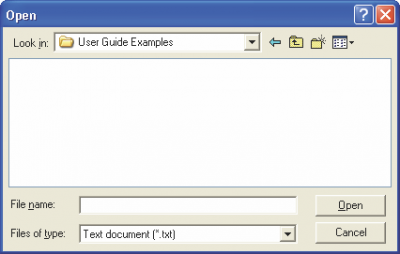
- Select Import from the File menu. A dialog prompts you for the file name from which to import.
To import all the elements of a multidimensional table (including all the slices), a special text for- mat is required (see “Default and XML model file formats” on page 344). This is also the format in which an edit table or result table is exported. The indexes of the table must have been previously created as nodes.
Exporting
To export a variable’s result table to a text file, first be certain that the text file is closed.
- Select the variable to be exported from and open its Result window.
- Select Export from the File menu. A dialog prompts you for the file name to export to.
Printing to a File
Another way of exporting any Diagram window, Object window, or Result window to a file is to print to a file:
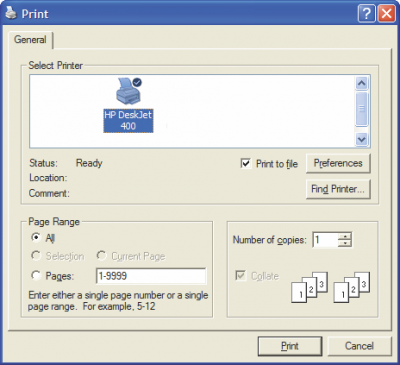
- Select Print from the File menu.
- Select Print to File and press Enter or click OK.
- Enter the name of the file and the format for the file in the dialog that appears.
Default and XML Model File Formats
Analytica supports two formats for saving models — the default format and an XML format. Both formats are fairly easy-to-read text files, which you can view and edit in standard text editors and word-processor applications. (See examples below.)
Analytica normally saves a new model in the default format. You can change to the XML format in by checking Save in XML Format in the Save as dialog when you first select Save from the File menu, or whenever you select Save as. It remembers and reuses the format you select in future sessions.
Sample default file format
The default format lists each object with each attribute on a separate line. The first line gives its class and identifier. Subsequent lines give each attribute name, followed by “:” followed by the attribute value. Here is part of a sample model file in the default format:
{ From user Richard Morgan, Model Sample_old_file_format ~~
at Jun 1, 2007 3:56 PM}

Softwareversion 4.0.0

Model Sample_old_file_format Title: Sample of old file format Author: Richard Morgan
Date: Jun 1, 2007 11:55 PM Savedate: Jun 1, 2007 3:56 PM

Objective Net_income
Title: Net income
Units: $ millions
Definition: Revenues - Expenses
Nodelocation: 304,64,1

Variable Revenues Title: Revenues Units: $ millions
Definition: 700 * (1+ 0.10)^(Year - 2003)
Nodelocation: 176,32,1

Variable Expenses Title: Expenses Units: $ millions
Definition: Table(Year)(750,750,780,800,850)
Nodelocation: 176,96,1

Close Sample_old_file_format
Sample XML file format
Close Sample_old_file_format
Here is part of the same model, saved in the XML format:
<?xml version="1.0" encoding="UTF-8" standalone="yes"?>
<ana user="Richard" project="Sample_XML_file_format" generated=" Jun
1, 2007 3:57 PM" softwareversion="4.0.0" software="Analytica">

<model name="Sample_XML_file_format">
<title>Sample XML file format</title>
<author>Richard Morgan</author>
<date> Jun 1, 2007 11:55 AM</date>
<saveauthor>Richard Morgan</saveauthor>
<savedate>Fri, Jun 1, 2007 3:57 PM</savedate>
<fileinfo>0,Model Sample_XML_file_format,
2,2,0,1, C:\Documents\Upgrade guide\Netincome example XML.ANA
</fileinfo>
<objective name="Net_income">
<title>Net income</title>
<units>$ millions</units>
<definition>Revenues - Expenses</definition>
<nodelocation>304,64,1</nodelocation>
<nodesize>48,24</nodesize>
<valuestate>2,313,273,197,250,0,MIDM
</valuestate>
<numberformat>1,D,4,2,0,1</numberformat>
 </objective>

<Variable name="Revenues">
<title>Revenues</title>
<units>$ millions</units>
<definition>700 * (1+ 0.10)^(Year - 2003)
</definition>
<nodelocation>176,32,1</nodelocation>
<nodesize>48,24</nodesize>
</Variable>
<Variable name="Expenses">
<title>Expenses</title>
<units>$ millions</units>
<definition>Table(Year)(750,750,780,800,850)
</definition>
<nodelocation>176,96,1</nodelocation>
<nodesize>48,24</nodesize>
</Variable>
</model>
</ana>
Edit Table Data Import/Export Format
Multidimensional data being imported or copied into an edit table must be in a text file with the special format described in this section. This is also the format in which an edit table or result table is exported.
- TextTable is a keyword.
- View is the name of the view from which the data originated. If your data was exported from an edit table, this is EditTable. If it was exported from a result table, it will be Value, Mean, Statistics, Probbands, PDF, CDF or Sample.
- Variable identifier is the identifier of the variable node where the data originated.
- Index identifier is the identifier of the index for this variable. An index with this name must already exist in the model, with the same length as in the file. When the index is a domain index, the <Index Identifier> is of the form Domain of <identifier>.
- Each index value and array value pair must be separated by tab characters.
- Numeric values appear directly, in any of Analytica’s standard number or date/time formats.
• Text values are enclosed in either double (") or single (') quotes. Tab and newline characters cannot appear between the quotes. If the text between the quotes includes a tab or newline character, it must be escaped using one of the sequences: \n, \r, \t. If a backslash or quote character appears in the text, it too must be escaped using \\, \' or \". (When the text is enclosed in double quotes, single quotes don’t have to be escaped, and vise versa). • Expressions (from edit table cells), which include distribution functions that might appear in edit table cells, appear without quotes as long as they single-line expressions (i.e., do not contain any newline characters), do not start and end with the same quote character (such as the expression "a" & "b"), and do not contain any tab character. Otherwise, the entire expression is enclosed between tildes, and the escape sequences \n, \r, \t, \\, \~ are used for newline, tab, backslash or tilde characters. For example, the following multi-line expression:
var s:= "~~”; JoinText(A,I,s) & '\' would appear as ~var s:= "\~\~”;\rJoinText(A,I,s) & '\\'~. • The value null may appear as «null».
One-dimensional array The format for a one-dimensional array is: TextTable <View> <Variable identifier> <line break> <Index identifier><line break> <Index value><tab><Array value><line break>
Example
Keyword View Variable identifier
TextTable Mean House_cost_inputs
House_inputs 'PropTax' 3400 'Tax rate' 0.44 'Maintenance' 4000 'Interest' 0.105 'Appreciation' 0.08
Index identifier
Index values Array values
Two-dimensional array
The format for a two-dimensional array is:
TextTable <View><Variable identifier><line break>
<Index1 identifier><tab><Index1 values separated by tabs>
<line break>
<Index2 identifier><line break>
<Index2 value1><tab><Array values separated by tabs><line break>
<Index2 value2><tab><Array values separated by tabs><line break>
<Index2 valueN><tab><Array values separated by tabs><line break>
Example
Keyword View Variable identifier
Index1 TextTable Value
Down payment Mortgage
20000 45000
60000 Index2 Buying price 200000 180000 155000 140000 400000 380000 355000 340000 600000 580000 555000 540000
Index2 values
Array values
Index1 values
Three-dimensional array The format for a three-dimensional array is: TextTable <View> <Variable identifier> <line break> <Index1 identifier><tab><Index1 Value1><line break> <Index2 identifier><tab><Index2 values separated by tabs><line break> <Index3 identifier><line break> <Index3 value1><tab><Array values separated by tabs><line break> <Index3 value2><tab><Array values separated by tabs><line break>
Example
<Index3 valueN><tab><Array values separated by tabs><line break> <Index1 identifier><tab><Index1 Value2><line break> <Index2 identifier><tab><Index2 values separated by tabs><line break> <Index3 identifier><line break> <Index3 value1><tab><Array values separated by tabs><line break> <Index3 value2><tab><Array values separated by tabs><line break> <Index3 valueN><tab><Array values separated by tabs><line break>
And so on for each value of Index1.
Keyword View Variable identifier
Index1
TextTable EditTable Net_diff Buying price 200000 Index1 Value1
Index
Index2 Index3
Years owned 5 10 15 Down payment
Index2 values
Array values
Index1 Value2
Index1 Value3
Number format
Numerical data can be imported in any format recognized by Analytica (see “Number formats” on page 78).
Numerical data is exported in the format set for the table, with these exceptions: • Suffix format numbers are exported in scientific exponential format. • Fixed decimal point numbers of more than 9 digits are exported in scientific exponential format. • If a date format begins with the day of the week, e.g., “Saturday, January 1, 2000”, the weekday is suppressed: “January 1, 2000”.


Enable comment auto-refresher