Tutorial: Create a model
This chapter shows you how to:
- Create a new model
- Create new variable nodes and enter attributes
- Move and delete variable nodes
- Draw influence arrows to define dependencies between variables
- Define variables as explicit values, functions and lists
- Invoke a built-in function to define a variable
- Do a simple Parametric Analysis
This chapter shows you how to create a new Analytica model.
In the process of building a model to analyze the costs of owning and operating an automobile, you will create variables, define dependencies, add documentary text, and compute results.
If Analytica is not open, start it by double-clicking its icon. If Analytica is already open with an active model go to the file menu, select close model, then select new model.
Creating a new model
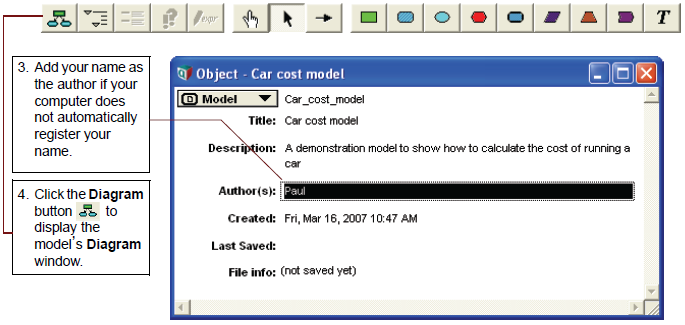
When you start up a new Analytica session it shows an Object window for an untitled model. Behind the Object window you will see an empty Diagram window.
First you should enter a Title for your model:
- Click in the Title attribute field (to the right of Title). Type in Car cost model and press Alt- enter. In the space just above the Title you entered, you will see that the Identifier field automatically changes to Car_cost_model.
- Press Tab to go to the Description attribute and type in: A demonstration model to show how to calculate the cost of running a car
If this is not a first-time entry for Title information, a dialog box will appear to confirm an automatic change to the Identifier.
You can either press the Tab key or use the mouse to move between fields.
Editing a diagram
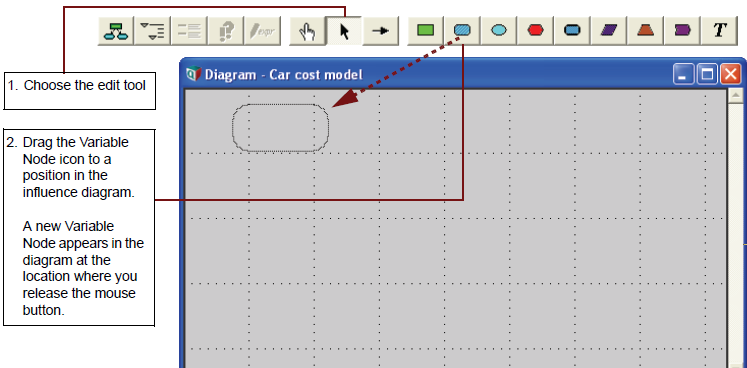
In most of the three previous chapters you were in the browse mode, with the browse tool ![]() highlighted in the tool palette. In browse mode you can view an existing model without changing its structure. When you create a new model the edit tool
highlighted in the tool palette. In browse mode you can view an existing model without changing its structure. When you create a new model the edit tool ![]() is selected by default. You use the edit tool to create or change a model.
is selected by default. You use the edit tool to create or change a model.
Be sure to note which tool is selected throughout the remainder of this tutorial.
When the edit tool is selected, a menu of icons is displayed in the node palette. These icons represent the different node types and allow you to add nodes to the diagram.
Creating variable nodes
In this chapter you will create variables in the Car Cost model.
Each variable is represented in the influence diagram as a shape that depicts the Class of Variable. These shapes are generally referred to as nodes. Select the node shape based on what you know about the variable. If you are not sure what kind of variable to use, choose a
General variable (![]() ).
).
See “Recognizing influence diagrams” on page 26 for a description of the node shapes.
As you build a model, you should select descriptive titles for your variables. Descriptive variable titles remind you of the model’s logic and help to inform others about how the model operates.
Fuel cost is filled with a diagonal line pattern around its text, indicating that it does not yet have a valid definition.
Repeat Steps 1 and 2 four times to create four more variables that affect fuel cost. Title these variables as follows:
- Fuel price (price per gallon of gasoline)
- Annual miles (number of miles driven each year)
- Mpg (miles per gallon of gasoline)
- Age (driver’s age)
Title text wraps to fit within the node as you type. You can manually create a new line in a title by pressing the Enter key at the desired break point(s). You can also expand the size of the node by dragging one of the corner handles.
Saving your model
Analytica automatically saves each change you make to a backup file. If your computer (or Analytica) should terminate unexpectedly, it will offer to recover your changes the next time you start Analytica. Even so, it’s a good idea to save your changes periodically.
- Select Save from the File menu (or press control-s). The first time you try to save a model, it shows a Save As dialog, offering to save the model in the My Documents folder using the model Title as the default file name. You can select another folder and modify the file name.
- Click Save or press Enter to save the model in the selected folder.
Deleting a variable
Sometimes you might want to delete a variable that you previously created.
In this example you realize that the driver’s age is not relevant to your understanding of the Fuel Cost variable. Therefore, you will delete the Age variable.
The Delete command cannot be undone; Analytica asks you to confirm that you want to delete.
Moving nodes
When you create a model you should try to structure the layout to make the influence diagram easy to understand. As you refine your model, however, you will undoubtedly want to group nodes in different ways to achieve this goal.
In this case we anticipate that Fuel cost will be derived from the other three variables. Therefore we want to place it apart.
Moving nodes is a simple matter of dragging them to the desired position. Try moving the nodes into the new configuration below.
You can select multiple nodes by holding down the Control or Shift keys, or by placing the cursor in a blank area and dragging diagonally to draw a rectangular frame across the nodes you want to select.
You can undo or redo a drag operation by selecting Undo/Redo from the Edit menu, or by typing the keyboard shortcut, Control+Z.
Editing variable titles
The name displayed inside each variable node is referred to as a Title. In this example you will expand the title Mpg to Miles per gallon:
Pause briefly between the click to select the node and the click to select the text within it. If you complete two single-clicks too quickly, Analytica interprets your actions as a double-click and opens an Object window.
If you accidentally open the Object window, return to the Diagram window by clicking the Diagram button ![]() .
.
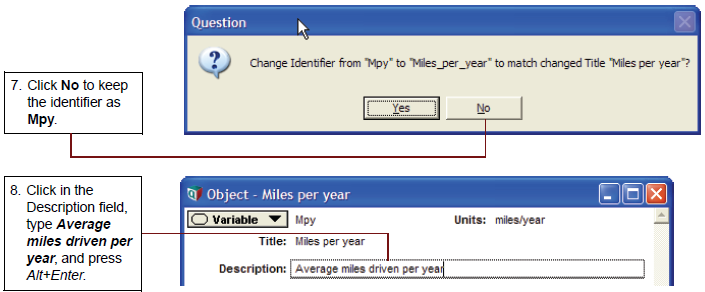
When you change the title of a node, Analytica asks you if you want the Identifier to be automatically changed as well.
You can change this behavior, to either turn off automatic updating of the identifier or to make it fully automatic, so that you are not asked. See the “Preferences dialog” section in Chapter 4 of the Analytica User Guide for details.
Drawing arrows between nodes
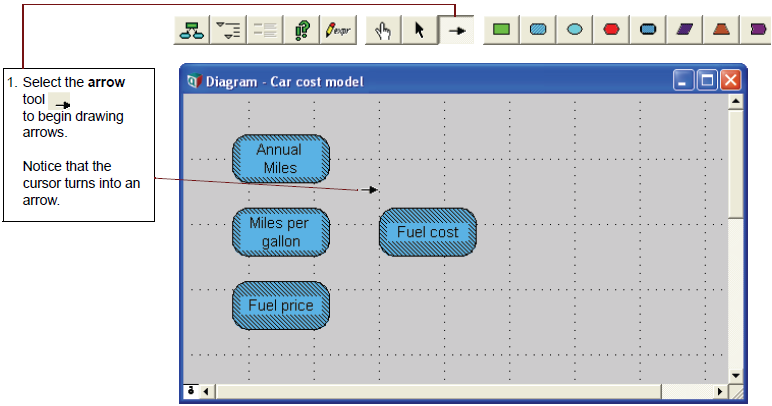
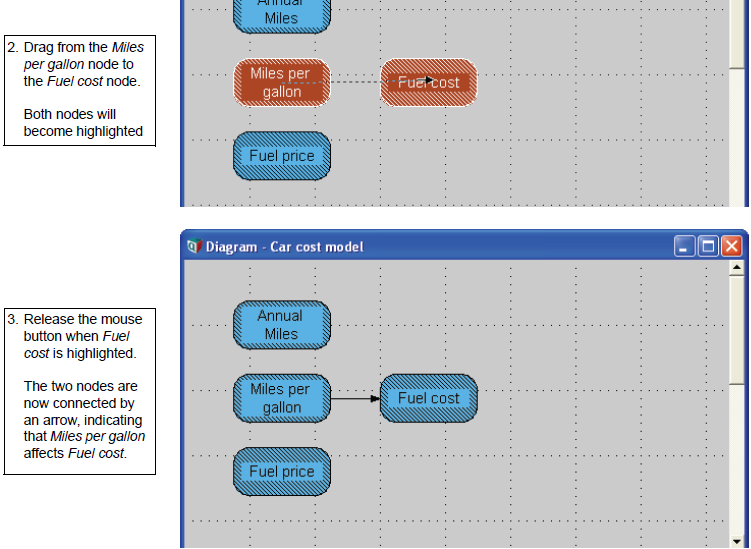
One of Analytica’s most powerful features is its ability to show relationships between variables in the influence diagram. Influence arrows are used to specify the dependencies between variables.
Because the Miles per gallon variable influences the Fuel cost variable, you will draw an arrow connecting the two nodes.
If the nodes are not connected by an arrow, repeat Steps #1 through #3.
Deleting an arrow
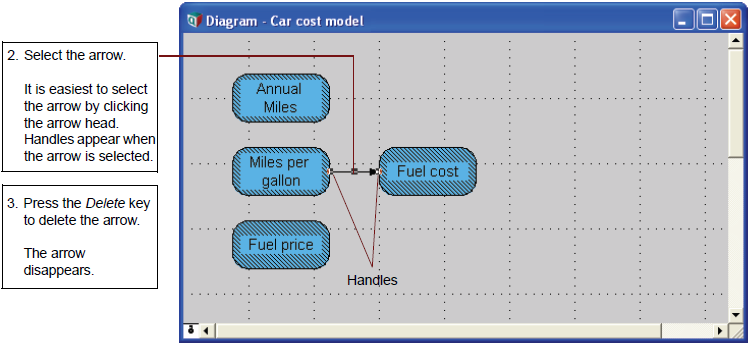
Occasionally, you might need to delete an arrow because of an earlier mistake or a change in your understanding of the model. This section shows you how to delete the arrow that connects Miles per gallon to Fuel cost.
You can delete an arrow using either the edit tool or the arrow tool.
First, make sure you have either the edit tool or arrow tool selected.
Connecting multiple arrows
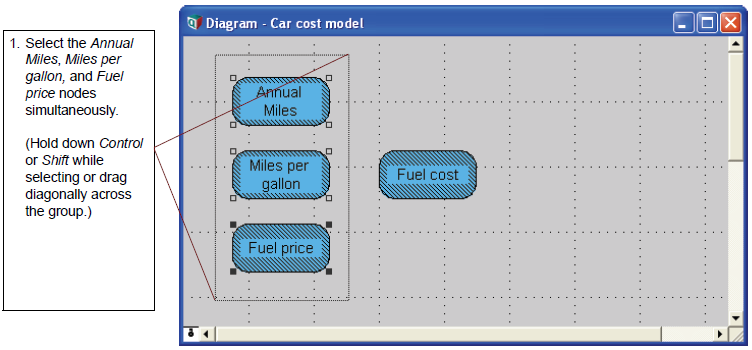
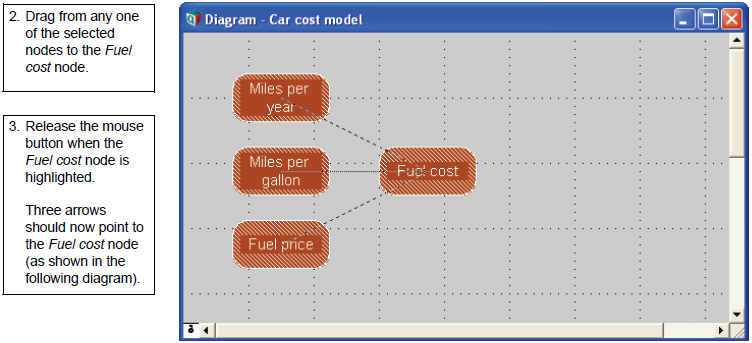
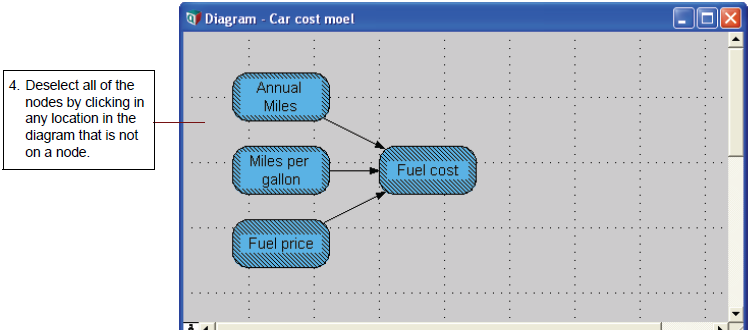
When one variable is influenced by several other variables, you can draw multiple arrows at once. This example shows you how to connect the three variables contributing to the Fuel cost variable.
First make sure the arrow tool is selected.
Entering attributes into the Object window
Each variable (or other Object) has an Object window that lets you see and edit its Attributes - including its Identifier, Title, Units, Description and Definition.
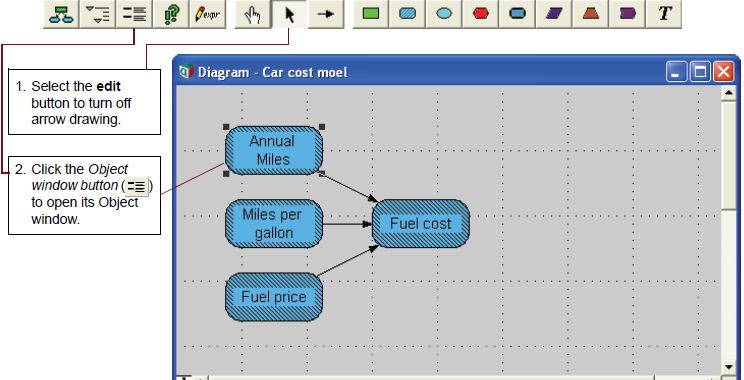
In this section we will use the Object window to enter attributes for the Annual Miles variable. Make sure to select the edit button (![]() ) before continuing.
) before continuing.
You can also open a variable’s Object window by double-clicking the node using the browse or arrow tools. If you are using the browse tool, you will not be able to enter or change documentation.
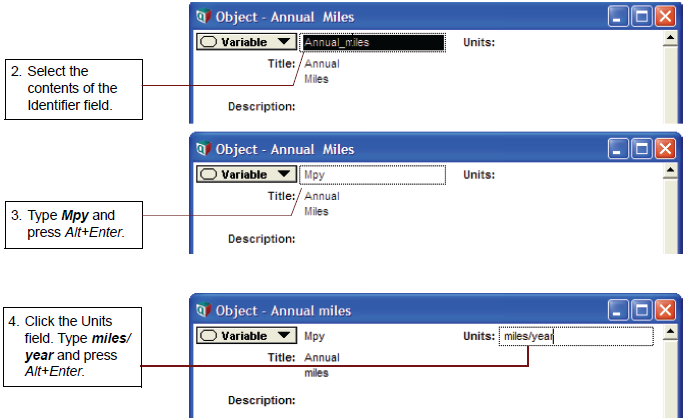
The identifier in the Object window shown above is Annual_miles. Analytica assigns the identifier when the title is created. It uses the first 20 characters of the title except for spaces or punctuation, which are replaced by underscores (_). Analytica does not differentiate between uppercase and lowercase letters in identifiers.
You can directly edit both the identifier and the title.
First, you will change the variable’s identifier to a short abbreviation so that it can easily be used later in the definitions of other variables. You will then document the variable more fully.
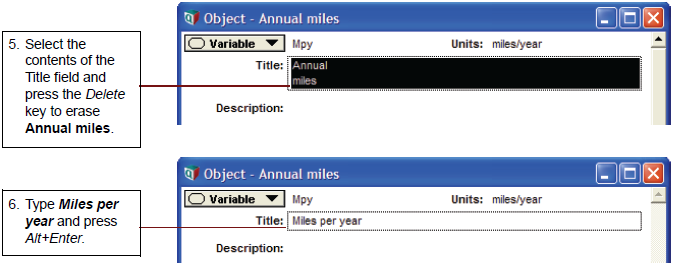
Analytica uses the information from the Units field to label graphs or tables that use the Miles per year variable; Analytica does not use it in any mathematical computations.
When you change the title of a node, Analytica asks you if you want it to automatically change the identifier to match the new title.
Defining a variable as an explicit value
Analytica uses a wide range of variable types. In this section we simply enter an explicit value for the variable. Functional expressions and lists are described later in this chapter. Other variable types are addressed in later chapters.
For variables as functional expressions see “Defining a variable as a function of other variables”.
For variables as lists see “Defining a variable as a list”.
For variable as tables see “Working with Arrays (Tables)”.
For a demonstration of built-in functions see “Defining a variable using a built-in function”.
First let’s define Miles per year as 12,000.
Numerical suffixes like μ and K are used extensively throughout Analytica. A quick reference for these suffixes is given on the back page of this tutorial.
Whenever another variable’s definition includes the identifier (Mpy) of Miles per year, this defined value, 12K, is used as its value.
Miles per year is no longer filled with a diagonal line pattern around its title, as shown in the figure below. The clear node indicates that Miles per year now has a valid definition.
Defining a variable as a function of other variables
When one variable is dependent upon another variable, you must provide an expression that describes the relationship between the variables. Influence arrows connecting other nodes to Fuel cost show the direction of this dependency.
In this section, you will enter a definition for Fuel cost in terms of the values of Miles per year, Miles per gallon, and Fuel price.
Because Fuel cost is equal to fuel price times miles driven, divided by miles per gallon, you will enter the following expression into the Definition field:
Fuel_price * Mpy / Mpg
An asterisk (*) represents multiplication; a slash (/) represents division.
Based on the definition you just entered, the value of Fuel cost is calculated by multiplying the values of Fuel price and Miles per year, and then dividing the result by the value of Miles per gallon.
Entering attributes using the Attribute panel
Sometimes you may find it more convenient to view or edit attributes of a variable in the Attribute Panel as part of the Diagram view instead of using a separate Object Window.
In this section, you will enter data for the Fuel price variable in the Attribute panel.
The Attribute panel appears below the diagram. You can use this view to enter or edit data for the currently selected variable in the influence diagram.
Now that you have entered attributes for the Fuel price variable, you will enter its definition in the Attribute panel.
In this example we will assume that Fuel price has a fixed value of $3 per gallon.
Select Definition from the Attribute popup menu and enter 3.
See Also
| Tutorial Chapter 3 <- | Tutorial Chapter 4 | -> Tutorial Chapter 5 |









Enable comment auto-refresher