Creating the Foxes and Hares diagram
- Continue with the same model; click on the diagram
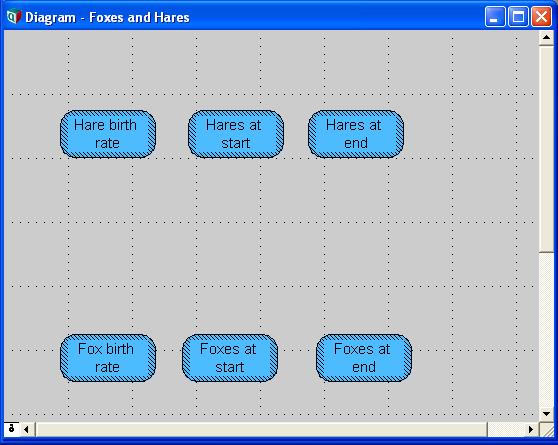
- Drag and drop 6 variable nodes in the diagram
- Set each node's name just like in the screenshot
- Switch on arrow tool.
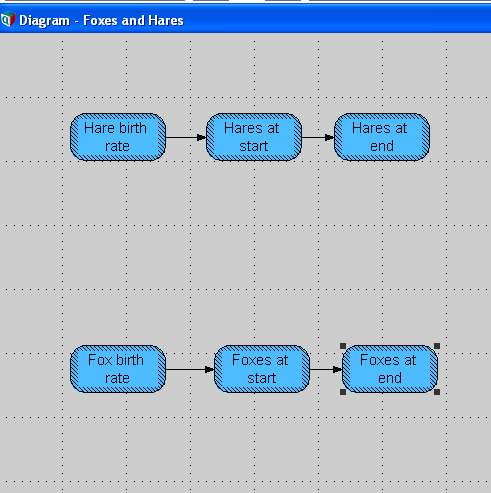
- Draw arrow from 'Hare birth rate' to 'Hares at start', and 'Hares at start' to 'Hares at end'.
- Do the same on Foxes' nodes
Expected: Nodes from left to right will be connected by arrows
See Also
Comments


Enable comment auto-refresher