Result menu
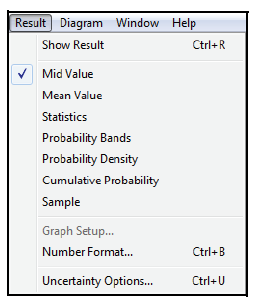
Menu item Description Show Result Opens a Result window for the selected object. See “The Result window” on page 26. Mid Value Displays the mid or deterministic value. See “Uncertainty views” on page 29. Mean Value Displays the mean of the uncertain value. See “Uncertainty views” on page 29.
Statistics Displays statistics of the uncertain value in a table as set in the Uncertainty Setup dialog. See “Uncertainty views” on page 29.
Probability Bands Shows probability bands (percentiles) as set in the Uncertainty Setup dialog. See “Uncertainty views” on page 29.
Probability Density
Displays a probability density graph for an uncertain value. For a discrete probability distribution, Probability Mass replaces
this command. See “Uncertainty views” on page 29.
Cumulative Probability
Displays a cumulative probability graph representing the probability that a variable’s value is less than or equal to each
possible (uncertain) value. See “Uncertainty views” on page 29.
Sample Displays a table of the values determined for each uncertainty sample iteration. See “Uncertainty views” on page 29.
Graph Setup Displays a dialog to specify the graphing tool, graph frame, and graph style. See “Graphing roles” on page 83.
Number Format Displays a dialog to set the number format for displays of results. See “Number formats” on page 78.
Uncertainty Options
Displays a dialog to specify the uncertainty sample size and sampling method and to set options for statistics, probability
bands, probability density, and cumulative probability. See
“Uncertainty Setup dialog” on page 257.

Comments
Enable comment auto-refresher