Tutorial: Reviewing a model
This chapter shows you how to explore a model by examining its:
- Influence diagrams
- Variables
- Attributes
- Definitions
- Results
This chapter assumes you have started Analytica and have opened the Rent vs. Buy model. If this is not the case, see “Opening the Rent vs. Buy model” on page 8. If you are using the model as modified from Chapter 1, change the value of Time horizon back to 10, the value of Monthly rent back to 1200, and the value of Buying price back to 140K. Also change the Rate of inflation back to a normal distribution with a mean of 3.5 and a standard deviation of 1.3.
In this chapter, you will examine the structure and contents of the Rent vs. Buy model.
The Rent vs. Buy model uses financial flow conventions: funds flowing in (received) have positive values; funds flowing out (expended) have negative values.
Recognizing influence diagrams
In this chapter, you will delve into some of the details of the Rent vs. Buy model. You will not use the top diagram that you used in Chapter 1.
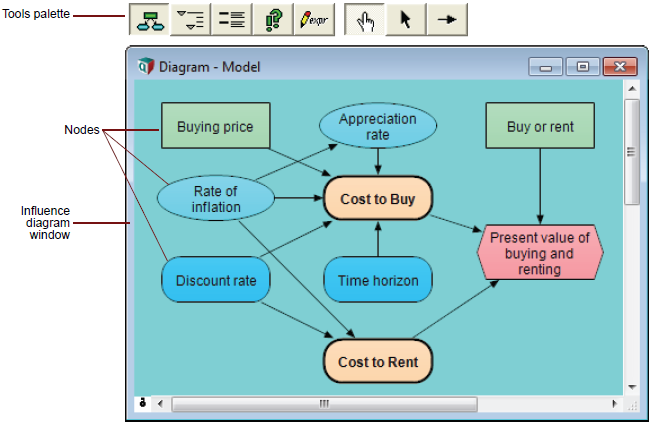
The details of an Analytica model display in an influence diagram window. An influence diagram (shown below) is a graphical representation of a model, showing how different variables in the model interact with each other. A typical influence diagram consists of a number of nodes connected by arrows.
Nodes represent variables and appear as boxes, ovals, hexagons, and other shapes. Different node shapes represent different types of variables. Analytica uses the term variable broadly to include anything that has a value or can be evaluated. Note that many of the variables have the same names as the inputs and output at the top diagram that you used in Chapter 1. The top diagram provides an easy way to see and change these nodes’ values.
Arrows connecting different variables indicate a relation between the variables. The arrow connecting Rate of inflation to Appreciation rate indicates that the value of the Appreciation rate variable depends on the value of the Rate of inflation variable. In the Rent vs. Buy model influence diagram, Cost to Buy depends on the Buying price, Rate of inflation, Appreciation rate, Discount rate, and Time horizon variables.
The following figure illustrates different types of nodes.
See Also
| Tutorial Chapter 1 <- | Tutorial Chapter 2 | -> Tutorial Chapter 3 |


Enable comment auto-refresher