Difference between revisions of "Completing the model"
| Line 1: | Line 1: | ||
| + | 1. Click icon button. Select ‘Definition’ from array popup menu. Click expr button, select table. | ||
| + | |||
| + | [[Image:Definition fuel cost1.3.jpg]] | ||
| + | |||
| + | 2. Click ‘Edit Table’ button. Edit table window should come up. | ||
| + | |||
| + | [[Image:Mpy edit table.jpg]] | ||
| + | |||
| + | <br> | ||
| + | [[Image:Index icon.jpg]] | ||
| + | |||
| + | 3. Click the ‘index’ icon. Indexes window should appear. Select ‘Car Type’, click >>. Repeat the same procedure for ‘Year’. Click ‘ok’ button. | ||
| + | |||
| + | [[Image:Index car type 1.1.jpg]] | ||
| + | |||
| + | 4. Edit table should appear, zero is entered by default . | ||
| + | |||
| + | <br> | ||
| + | [[Image:Edit table Mpy.jpg]] | ||
| + | |||
| + | 5. Select the 1st column. Enter ‘12K’. Press arrow down key. Enter ‘12K’. | ||
| + | |||
| + | |||
| + | [[Image:Edit table Mpy1.1.jpg]] | ||
| + | |||
| + | |||
| + | 6. Select 2nd column, enter ‘20K’ press arrow down key enter ‘12K’. Repeat the same for the 3rd column, enter ‘12K’ for the 1st and 2nd row. | ||
| + | |||
| + | [[Image:Edit table Mpy1.2.jpg]] | ||
| + | |||
| + | 7. Select ‘fuel cost’. Click ‘Result’ from the menu items, select ‘mid value’. Result table window should appear. | ||
| + | |||
| + | [[Image:Mid value Fuel Cost1.1.jpg]] | ||
| + | |||
| + | 8. Examine mid value of fuel cost. | ||
| + | |||
| + | [[Image:Result Fuel Cost1.1.jpg]] | ||
| + | |||
| + | 9. Click diagram button to return to parent diagram. Select ‘Total cost’. Click the result button to examine the mid value. | ||
| + | |||
| + | [[Image:Result total cost1.4.jpg]] | ||
| + | |||
| + | |||
| + | |||
| + | |||
| + | |||
| + | |||
| + | |||
| + | |||
| + | |||
| + | |||
| + | |||
| + | |||
| + | |||
:'''a.''' Bring up ‘object window’ of ‘Maintenance cost’node. | :'''a.''' Bring up ‘object window’ of ‘Maintenance cost’node. | ||
:'''b.''' Type ‘$/year’ on ‘Units’ field | :'''b.''' Type ‘$/year’ on ‘Units’ field | ||
Revision as of 07:02, 11 September 2007
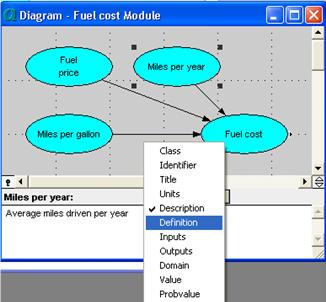
1. Click icon button. Select ‘Definition’ from array popup menu. Click expr button, select table.
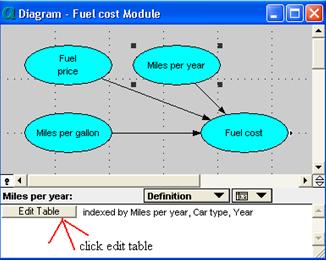
2. Click ‘Edit Table’ button. Edit table window should come up.
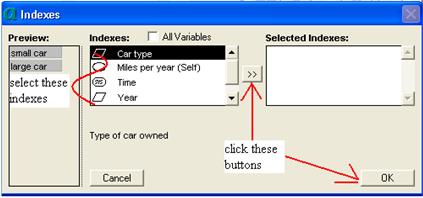
3. Click the ‘index’ icon. Indexes window should appear. Select ‘Car Type’, click >>. Repeat the same procedure for ‘Year’. Click ‘ok’ button.
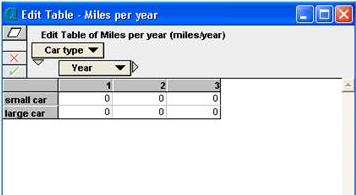
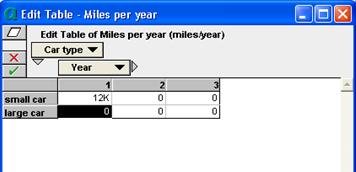
4. Edit table should appear, zero is entered by default .
5. Select the 1st column. Enter ‘12K’. Press arrow down key. Enter ‘12K’.
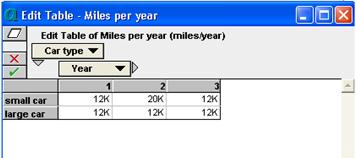
6. Select 2nd column, enter ‘20K’ press arrow down key enter ‘12K’. Repeat the same for the 3rd column, enter ‘12K’ for the 1st and 2nd row.
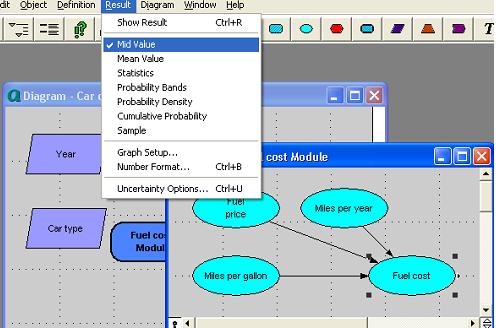
7. Select ‘fuel cost’. Click ‘Result’ from the menu items, select ‘mid value’. Result table window should appear.
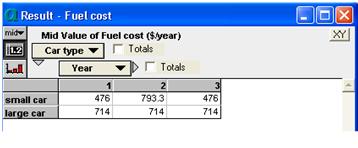
8. Examine mid value of fuel cost.
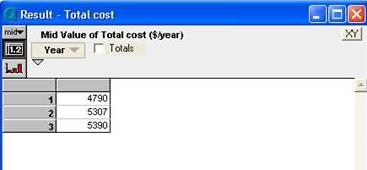
9. Click diagram button to return to parent diagram. Select ‘Total cost’. Click the result button to examine the mid value.
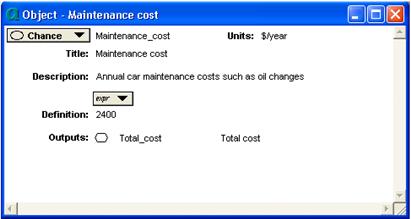
- a. Bring up ‘object window’ of ‘Maintenance cost’node.
- b. Type ‘$/year’ on ‘Units’ field
- c. In ‘Description’ field, type ‘Annual car maintenance costs such as oil changes’
- d. Enter ‘2400’ in the ‘Definition’ field
- e. Press ‘alt+enter’ to accept
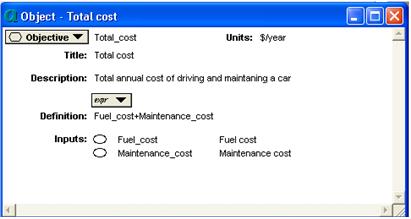
- f. Bring up ‘object window’ of ‘Total cost’ node.
- g. Type ‘$/year’ on ‘Units’ field.
- h. Type ‘Total annual cost of driving and maintaining a car’ in ‘Description’ field.
- i. On ‘Definition’ field, click ‘inputs’. Select ‘Fuel_cost’. Key in ‘+’ sign. Click ‘inputs’ again, this time select ‘Maintenance cost’
- j. Click Result button to evaluate total cost.
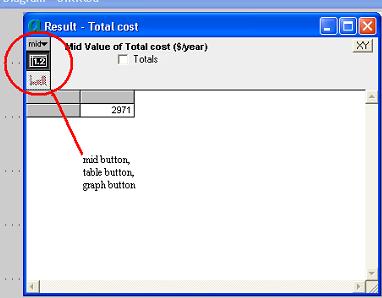
- k. The Result window should come up and it’s value should be 2971
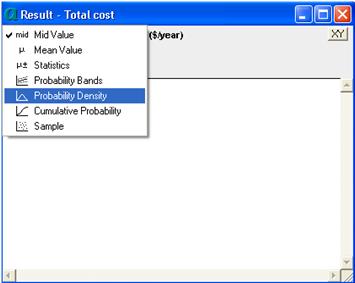
- k. Click ‘mid’ button, select ‘probability density’
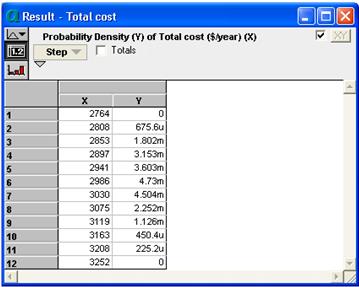
- l. You should have a result table.
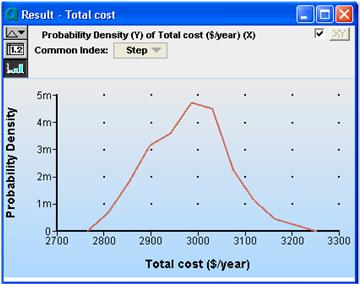
- m. Click on the graph button. You should have a graph result that looks like the one below.
Enable comment auto-refresher