Difference between revisions of "Color palette"
(Created page with "category:Windows and dialogs == The Color palette == image:Color palette.png The color palette is used to change the color of nodes or text in an influence diagram....") |
m (→See Also) |
||
| (9 intermediate revisions by 2 users not shown) | |||
| Line 1: | Line 1: | ||
[[category:Windows and dialogs]] | [[category:Windows and dialogs]] | ||
| + | This dialog box lets you change the color of nodes, background, or text in an influence diagram: | ||
| − | + | :[[image:Color palette.png]] | |
| − | + | === Show the color palette === | |
| − | + | To display the color palette, select '''Show Color Palette''' from the '''Diagram Menu'''. This option is available when you have an influence diagram window in focus. The [[Color palette]] is visible only when you are working with a diagram window. You can move it anywhere on your monitor, including outside of the boundaries of the main Analytica window, so that it doesn't take up screen space where you are working. | |
| − | === | + | === Change the diagram background color === |
| − | To | + | To change the color of the diagram background, first make sure no nodes are selected in the diagram. You can do this by simply clicking the background (outside any nodes or arrows). Make sure to select fill mode in the color palette: |
| − | |||
| − | |||
| − | |||
| − | |||
| − | |||
| − | |||
:[[image:ColorPaletteFill.png]] | :[[image:ColorPaletteFill.png]] | ||
Then click on the desired color swatch. | Then click on the desired color swatch. | ||
| − | + | Each diagram inherits the background color of its parent diagram, unless you give it a new background color. This means that when you set a background color of a diagram, all the submodules of that module will use the same new background color -- unless they already have been set to a different color. If you reset a submodule diagram to have the same background color as its parent, the submodule will again inherit its parents color. Then if you change the parent's background color, it will again propagate to its submodule. | |
| − | === | + | === Change node color === |
| − | To change the fill color for one or more nodes, first select | + | To change the fill color for one or more nodes, first select the nodes in their diagram. Make sure to select fill mode in the color palette: |
:[[image:ColorPaletteFill.png]] | :[[image:ColorPaletteFill.png]] | ||
| − | Then click | + | Then click the desired color swatch and the node colors will change. |
| − | + | The [[Node Style Dialog|node style]] settings for each node has a '''Fill Color''' checkbox. If that style is unchecked, the node is transparent, and you won't see your selected color. '''Fill Color''' is on by default for variables, and all other classes of node except Text and Picture nodes. If you want to set a color for a Text and Picture node, for example to enclose a group of node, you need to check '''Fill Color''' in the '''Node Style dialog''' from the '''Diagram menu'''. | |
For [[User Input nodes]] and [[User Output nodes]], you can change the color of the button or control on the node (except for choice controls, whose color scheme is fixed) in the same manner described here. If you don't set the color of the user input/output node, the color of its variable is used. | For [[User Input nodes]] and [[User Output nodes]], you can change the color of the button or control on the node (except for choice controls, whose color scheme is fixed) in the same manner described here. If you don't set the color of the user input/output node, the color of its variable is used. | ||
| − | === | + | === Change the text color of nodes === |
| − | ''new | + | ''new in [[Analytica 5.0]]'' |
| − | To change the text color | + | To change the text color of one or more nodes, click the node(s) to select it (them). In the Color palette, click the button in top left to change to Font color mode: |
:[[image:ColorPaletteFont.png]] | :[[image:ColorPaletteFont.png]] | ||
| − | + | Now just click a color box to change the text color for the selected node(s). | |
| + | |||
| + | You can also set the default text color for all nodes in a diagram, including any new nodes and all nodes in submodules. First, deselect all nodes (click on the background). Make sure the Font color model is selected in the color palette. And click a color box. | ||
| − | + | This will change the font color for all nodes, except any whose font color was previously set to a non-default. | |
| − | + | For any node with text set to a non-default color, if you reset to have the same font color as its parent diagram, it will then inherit that color from its parent in case of any future changes to the parent. | |
| − | === | + | === The custom colors row === |
| + | (''new in [[Analytica 5.0]]'') | ||
| − | + | It's often convenient to define a set of custom colors to define a consistent color scheme for nodes, background, or text. For this purpose, use the custom colors row of 16 colors across the bottom of the Color Palette: | |
| + | |||
| + | :[[image:ColorPaletteCustomColoroRow.png]] | ||
| + | |||
| + | Click the '''Other ...''' button to see other colors and redefine your custom colors. | ||
| + | |||
| + | === Using Other Colors === | ||
| + | |||
| + | The '''Other...''' button shows this standard Microsoft Windows tool to let color geeks select any possible color: | ||
:[[image:ColorPaletteOther.png]] | :[[image:ColorPaletteOther.png]] | ||
| − | + | This tool lets you specify colors in several ways: | |
| + | * Click or drag the point in the '''color square''' on the right to specify a color.. Its horizontal position sets '''hue'''. Vertical position sets '''saturation''' (pure or mixed color), and the vertical slider on the right sets '''luminance''' (make a '''''tint''''' adding white upwards, or ''shade'' adding black downwards) vertically on the right edge. ([[See]]<nowiki> http://en.wikipedia.org/wiki/Tints_and_shades) </nowiki> | ||
| + | * Specify a color using '''HSL''', i.e. '''Hue''', '''Sat'''uration, and '''Lum'''inance,''' '''as numbers 0 to 255 | ||
| + | * Specify a color using '''RGB''' , i.e. '''Red''', '''Green''', or '''Blue, '''as numbers 0 to 255 | ||
| + | |||
| + | To define your own '''Custom colors:''' | ||
| + | * First, select one of the 16 '''Custom Colors''' boxes. This is the custom color you will change. | ||
| + | * Select a new color using any of the Basic colors, or using the color square. | ||
| + | * Press '''Add to Custom Colors''' to change the selected custom color to use that color. | ||
| + | |||
| + | '''Note:''' ''These Custom colors are your own personal palette. They are not stored with the model, but as your own personal setting on this computer. They will be available in the Color palette in any Analytica model that you open on this computer. '' | ||
| + | |||
| + | <nowiki> </nowiki>(Ignore the '''Define Custom Colors >>''' button.) | ||
| − | + | === History === | |
| − | |||
| − | |||
| − | |||
| − | + | * The ability to change font color was introduced in [[Analytica 5.0]]. | |
| + | * The display of your custom colors on the palette was introduced in [[Analytica 5.0]]. | ||
| − | == See Also == | + | === See Also === |
* [[Color in influence diagrams]] from the User Guide | * [[Color in influence diagrams]] from the User Guide | ||
| Line 66: | Line 82: | ||
* [[NodeFontColor]] attribute | * [[NodeFontColor]] attribute | ||
* [[DiagramColor]] attribute | * [[DiagramColor]] attribute | ||
| + | * [[Color parameters]] as a word or hex number to specify colors. | ||
Latest revision as of 19:26, 16 April 2020
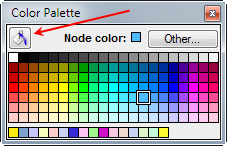
This dialog box lets you change the color of nodes, background, or text in an influence diagram:
Show the color palette
To display the color palette, select Show Color Palette from the Diagram Menu. This option is available when you have an influence diagram window in focus. The Color palette is visible only when you are working with a diagram window. You can move it anywhere on your monitor, including outside of the boundaries of the main Analytica window, so that it doesn't take up screen space where you are working.
Change the diagram background color
To change the color of the diagram background, first make sure no nodes are selected in the diagram. You can do this by simply clicking the background (outside any nodes or arrows). Make sure to select fill mode in the color palette:
Then click on the desired color swatch.
Each diagram inherits the background color of its parent diagram, unless you give it a new background color. This means that when you set a background color of a diagram, all the submodules of that module will use the same new background color -- unless they already have been set to a different color. If you reset a submodule diagram to have the same background color as its parent, the submodule will again inherit its parents color. Then if you change the parent's background color, it will again propagate to its submodule.
Change node color
To change the fill color for one or more nodes, first select the nodes in their diagram. Make sure to select fill mode in the color palette:
Then click the desired color swatch and the node colors will change.
The node style settings for each node has a Fill Color checkbox. If that style is unchecked, the node is transparent, and you won't see your selected color. Fill Color is on by default for variables, and all other classes of node except Text and Picture nodes. If you want to set a color for a Text and Picture node, for example to enclose a group of node, you need to check Fill Color in the Node Style dialog from the Diagram menu.
For User Input nodes and User Output nodes, you can change the color of the button or control on the node (except for choice controls, whose color scheme is fixed) in the same manner described here. If you don't set the color of the user input/output node, the color of its variable is used.
Change the text color of nodes
new in Analytica 5.0
To change the text color of one or more nodes, click the node(s) to select it (them). In the Color palette, click the button in top left to change to Font color mode:
Now just click a color box to change the text color for the selected node(s).
You can also set the default text color for all nodes in a diagram, including any new nodes and all nodes in submodules. First, deselect all nodes (click on the background). Make sure the Font color model is selected in the color palette. And click a color box.
This will change the font color for all nodes, except any whose font color was previously set to a non-default.
For any node with text set to a non-default color, if you reset to have the same font color as its parent diagram, it will then inherit that color from its parent in case of any future changes to the parent.
The custom colors row
(new in Analytica 5.0)
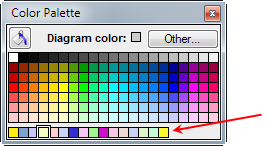
It's often convenient to define a set of custom colors to define a consistent color scheme for nodes, background, or text. For this purpose, use the custom colors row of 16 colors across the bottom of the Color Palette:
Click the Other ... button to see other colors and redefine your custom colors.
Using Other Colors
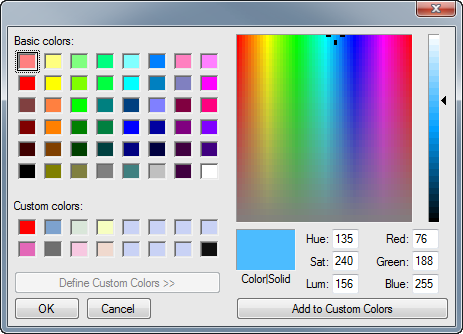
The Other... button shows this standard Microsoft Windows tool to let color geeks select any possible color:
This tool lets you specify colors in several ways:
- Click or drag the point in the color square on the right to specify a color.. Its horizontal position sets hue. Vertical position sets saturation (pure or mixed color), and the vertical slider on the right sets luminance (make a tint adding white upwards, or shade adding black downwards) vertically on the right edge. (See http://en.wikipedia.org/wiki/Tints_and_shades)
- Specify a color using HSL, i.e. Hue, Saturation, and Luminance, as numbers 0 to 255
- Specify a color using RGB , i.e. Red, Green, or Blue, as numbers 0 to 255
To define your own Custom colors:
- First, select one of the 16 Custom Colors boxes. This is the custom color you will change.
- Select a new color using any of the Basic colors, or using the color square.
- Press Add to Custom Colors to change the selected custom color to use that color.
Note: These Custom colors are your own personal palette. They are not stored with the model, but as your own personal setting on this computer. They will be available in the Color palette in any Analytica model that you open on this computer.
(Ignore the Define Custom Colors >> button.)
History
- The ability to change font color was introduced in Analytica 5.0.
- The display of your custom colors on the palette was introduced in Analytica 5.0.
See Also
- Color in influence diagrams from the User Guide
- Changing Series Colors: For changing colors in graphs.
- Cell format dialog: For changing colors in a table
- NodeColor attribute
- NodeFontColor attribute
- DiagramColor attribute
- Color parameters as a word or hex number to specify colors.


Enable comment auto-refresher