Difference between revisions of "Graphing Examples"
(Page spacing) |
|||
| Line 1: | Line 1: | ||
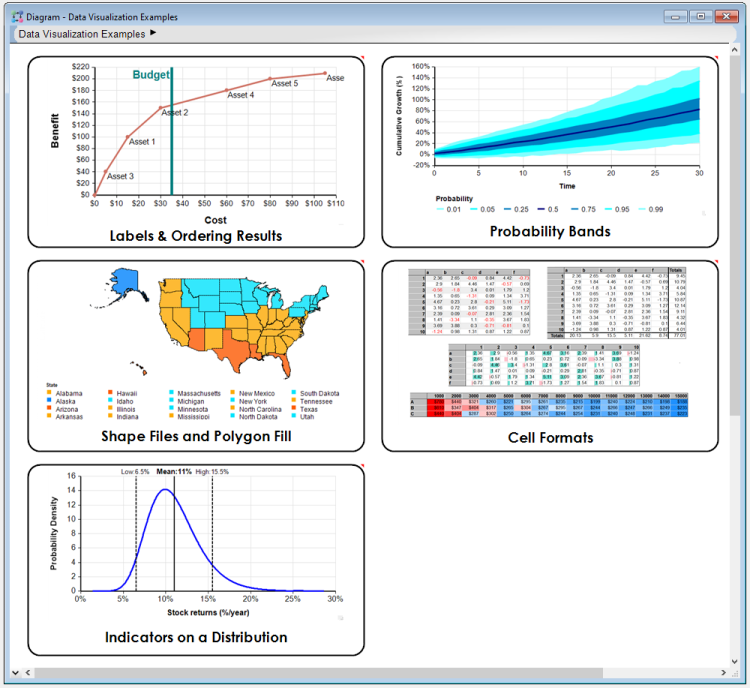
| − | The [[ | + | The [[Media:Data Visualization Examples.ana|Data Visualization Examples.ana]] model shows off several displays from cell formatting to maps and much more between. |
<center> | <center> | ||
:[[image:Data_Visualization_Examples.png|750px]] | :[[image:Data_Visualization_Examples.png|750px]] | ||
</center> | </center> | ||
| + | |||
Creating custom graphs is often underutilized due to its syntax being unconnected to any other programming languages. Given this and rising demand for [[Analytica Cloud Platform (ACP)]] models, it only made sense to create a comprehensive model that took several commonly requested displays with detailed step-by-step instructions so that users can confidently extend what they learn from this model into their own models. | Creating custom graphs is often underutilized due to its syntax being unconnected to any other programming languages. Given this and rising demand for [[Analytica Cloud Platform (ACP)]] models, it only made sense to create a comprehensive model that took several commonly requested displays with detailed step-by-step instructions so that users can confidently extend what they learn from this model into their own models. | ||
| Line 11: | Line 12: | ||
</center> | </center> | ||
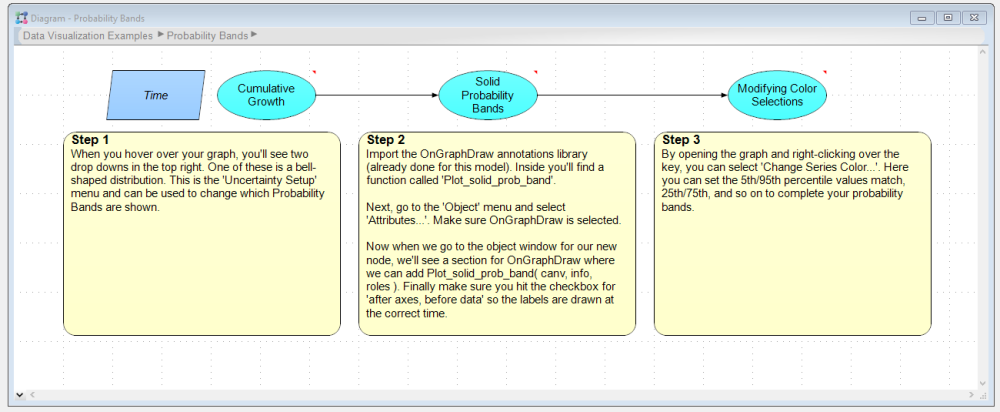
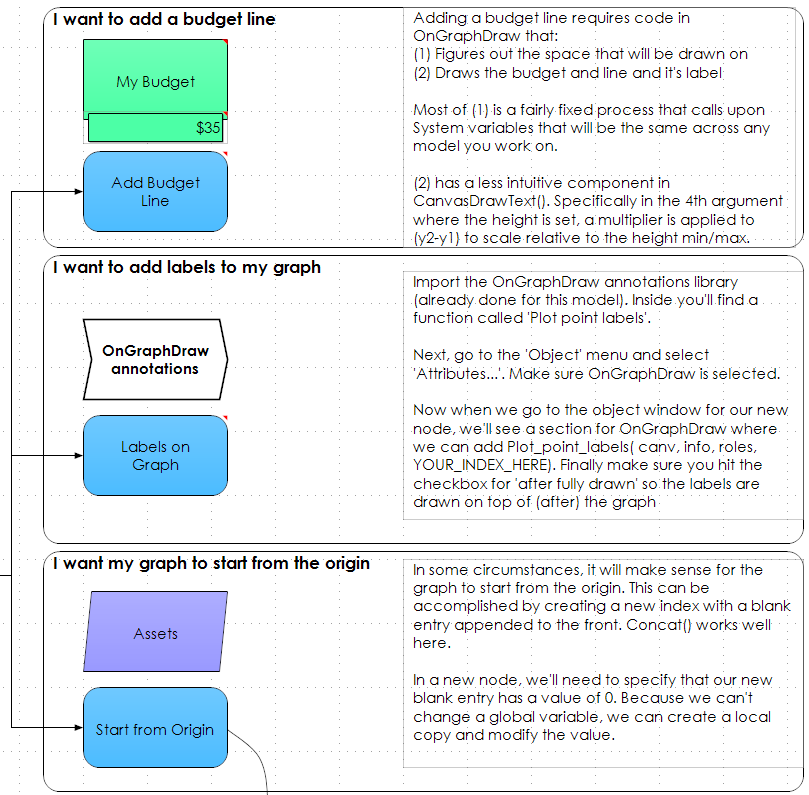
| − | Only want to recreate on specific feature? No problem. With the [[ | + | Only want to recreate on specific feature? No problem. With the [[Media:Data Visualization Examples.ana|Data Visualization Examples.ana]] model we made it a point to breakdown complex graphs into multiple digestible parts to create an easier learning experience. |
<center> | <center> | ||
:[[image:Data_Visualization_Examples_Labels_Ordering_Results.png|1000px]] | :[[image:Data_Visualization_Examples_Labels_Ordering_Results.png|1000px]] | ||
</center> | </center> | ||
Revision as of 07:39, 17 October 2023
The Data Visualization Examples.ana model shows off several displays from cell formatting to maps and much more between.
Creating custom graphs is often underutilized due to its syntax being unconnected to any other programming languages. Given this and rising demand for Analytica Cloud Platform (ACP) models, it only made sense to create a comprehensive model that took several commonly requested displays with detailed step-by-step instructions so that users can confidently extend what they learn from this model into their own models.
Only want to recreate on specific feature? No problem. With the Data Visualization Examples.ana model we made it a point to breakdown complex graphs into multiple digestible parts to create an easier learning experience.
Comments


Enable comment auto-refresher