|
|
| Line 1: |
Line 1: |
| − | 1. Drag two variable nodes in the diagram. Type ‘Hares needed by 1 fox’ and ‘Foxes surviving’ for each node.
| + | # Select Populations, click on the result button. |
| | | | |
| − | 2. Draw arrow from ‘Hares needed by 1 fox’ to ‘Foxes surviving’, from ‘Hares captured’ to ‘Fox surviving’; and from ‘Foxes surviving’ to ‘Foxes at end’.
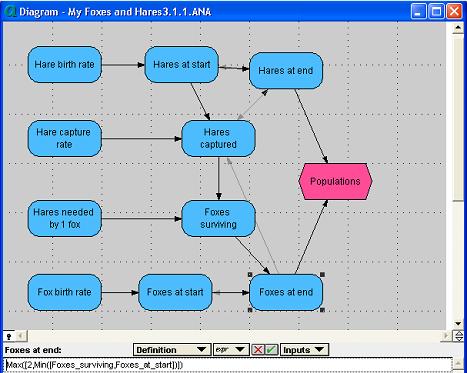
| + | # Select Foxes at end, click on its key icon. Select Definition from the Attribute popup menu. Type ‘Max([2,Min([Foxes_surviving,Foxes_at_start])])’ |
| − | | |
| − | [[Image:Foxes and Hares diagram 12.jpg]]
| |
| − | | |
| − | 3. Double click on ‘Hares needed by 1 fox’ to open its object window. Click on the Identifier field, change it to ‘Hares_needed’. Press tab. In the Description field type ‘Number of hares that one fox must capture in a time period to survive.’ Press tab. In the Definition field key in 10. Click on green green check button to accept definition.
| |
| − | | |
| − | '''Expected:You should have the same result as the screenshot below'''
| |
| − | | |
| − | [[Image:Object Hares needed.jpg]]
| |
| − | | |
| − | 4. Double click on Foxes surviving to open its Object window. In the Description field type ‘Number of foxes surviving a time period, by eating the numbers of hares captured’. Press tab. In the Definition field type ‘Hares_captured/Hares_needed’.
| |
| − | | |
| − | [[Image:Object Foxes surviving.jpg]]
| |
| − | | |
| − | 5. Select Foxes at end. Click on the key icon to open the attribute panel. Click on the popup menu, select Definition. Type ‘Min([Foxes_surviving,Foxes_at_start])’
| |
| − | | |
| − | [[Image:Foxes and Hares diagram 13.jpg]]
| |
| − | | |
| − | 6. Select Populations, click on the result button.
| |
| − | | |
| − | 7. Select Foxes at end, click on its key icon. Select Definition from the Attribute popup menu. Type ‘Max([2,Min([Foxes_surviving,Foxes_at_start])])’
| |
| | | | |
| | [[Image:Foxes and Hares diagram 14.jpg]] | | [[Image:Foxes and Hares diagram 14.jpg]] |
| | | | |
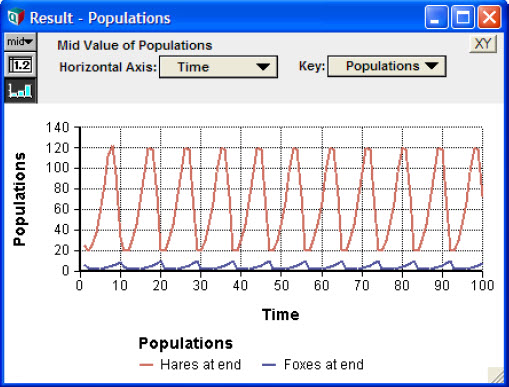
| − | 8. Select Populations, click on the result button.
| + | # Select Populations, click on the result button. |
| | | | |
| | '''Expected:You should have the same result as the screen shot below''' | | '''Expected:You should have the same result as the screen shot below''' |
| | | | |
| | [[Image:Populations end.jpg]] | | [[Image:Populations end.jpg]] |
Revision as of 07:24, 7 October 2010
- Select Populations, click on the result button.
- Select Foxes at end, click on its key icon. Select Definition from the Attribute popup menu. Type ‘Max([2,Min([Foxes_surviving,Foxes_at_start])])’
- Select Populations, click on the result button.
Expected:You should have the same result as the screen shot below


Enable comment auto-refresher