Difference between revisions of "Defining the population control: foxes capture hares"
| (29 intermediate revisions by 6 users not shown) | |||
| Line 1: | Line 1: | ||
| + | [[Category: Foxes and Hares model]] | ||
| + | [[Category: Definitions]] | ||
| + | |||
1. Drag two variable nodes in the diagram, type ‘Hare capture rate’ and ‘Hares captured’ for the title. | 1. Drag two variable nodes in the diagram, type ‘Hare capture rate’ and ‘Hares captured’ for the title. | ||
| − | [[Image:Foxes and Hares diagram 1.6.jpg]] | + | :[[Image:Foxes and Hares diagram 1.6.jpg]] |
| + | |||
| + | 2. Draw arrow from ‘Hare capture rate’ to ‘Hares captured’. | ||
| + | |||
| + | 3. Draw arrow from 'Hares captured' to 'Hares at end'. | ||
| + | |||
| + | :[[Image:Foxes and Hares diagram 1.7.jpg]] | ||
| + | |||
| + | 4. Double click on Hare capture rate to open its object window. | ||
| + | |||
| + | 5. In the Description field type ‘Percentage of hares captured by each fox during a time period.' Press Alt+Enter to go to the definition field. | ||
| + | |||
| + | 6. In the Definition field type ‘25%’, press alt+enter. | ||
| + | |||
| + | '''Expected: Your object window should look like the screen shot below''' | ||
| + | |||
| + | :[[Image:Object hare capture.jpg]] | ||
| + | |||
| + | 7. Select Hares captured. Select Description from the Attribute pulldown menu in the attribute pane. Type ‘Number of hares captured during a time period’. | ||
| + | |||
| + | :[[Image:Foxes and Hares diagram 1.8.jpg]] | ||
| + | |||
| + | 8. Draw arrows from both ‘Hares at end’ and ‘Foxes at end’ to ‘Hares captured’. | ||
| + | |||
| + | '''Expected: Your diagram should look like the screen shot below.''' | ||
| + | |||
| + | :[[Image:Foxes and Hares diagram 1.9.jpg]] | ||
| + | |||
| + | 9. Select Hares captured. Select Definition from the Attribute pulldown menu, type Dynamic(75,Hare_capture_rate*Hares_at_end[Time-1]*Foxes_at_end[Time-1]). Press alt+enter. | ||
| + | |||
| + | :[[Image:Foxes and Hares diagram 10.jpg]] | ||
| + | |||
| + | 10. Click on the result button. | ||
| + | |||
| + | '''Expected:Result window should appear.''' | ||
| + | |||
| + | :[[Image:Result Hares captured.jpg]] | ||
| − | + | 11. Close the Result window. | |
| − | + | 11.1 Select Hares at end on the diagram | |
| − | + | 11.2 In the Attribute panel, edit the definition of Hares at end and change it to ' Hares_at_start - Hares_captured '. | |
| − | + | 12. Select 'Hares captured' press ctrl+e to open its attribute panel. | |
| − | + | 13. In the Attribute pulldown menu select Definition. Copy and paste this: Dynamic(75,Min([Hares_at_start-20,Hare_capture_rate*Hares_at_end[Time-1]*Foxes_at_end[Time-1]])) | |
| − | + | 14. Drag and drap 2 variable nodes, give it a title 'Hares needed by 1 fox' and 'Foxes surviving' | |
| − | + | :[[Image:Hares needed by 1 fox.jpg]] | |
| − | + | 16. Drag arrow tool from 'Hares needed by 1 fox' to 'Foxes surviving' | |
| − | + | 17. Drag and drop the mouse from 'Foxes surviving' to 'Foxes at end' to create an arrow. | |
| − | [[Image: | + | :[[Image:Hares needed by 1 fox arrow.jpg]] |
| − | + | 19. Double click on 'Hares needed by 1 fox' node to open it's object window | |
| − | + | 20. Click on Identifier field and change identifier to 'Hares_needed' | |
| − | + | 21. Press tab to go to 'Description' field | |
| − | + | 22. Type 'Number of hares that one fox must capture in a time period to survive' | |
| − | + | 23. Press tab key again to go down to 'Definition' field | |
| − | + | 24. Set definition to 10 | |
| − | + | 25. Click on green arrow check box to accept definition. Close the Object window. | |
| − | |||
| − | + | 26. Double click on 'Foxes surviving' node to open it's object window | |
| − | + | 27. Click on tab key to go down to Description attribute and copy and paste this without the quotes 'Number of foxes surviving a time period, by eating the number of hares captured' | |
| − | + | 28. Press Alt+Enter to move down to Definition field | |
| − | + | 29. Key in 'Hares_captured/Hares_needed'. | |
| − | + | 30. Press green check button to accept definition. | |
| − | + | 31. Close Object window. | |
| − | + | '''Expected: Diagram looks like the screen shot below''' | |
| − | + | :[[Image:Hares needed defined.jpg]] | |
| − | + | 32. Click on 'Foxes at end'. | |
| − | + | 33. Press ctrl+e to open it's attribute pane. | |
| − | + | 34. Key in 'Min([Foxes_surviving,Foxes_at_start])' | |
| − | + | :[[Image: Foxes at end attribute pane.jpg]] | |
| − | + | 35. Click on check button to accept definition | |
| − | + | 36. Click 'Population' node. | |
| − | + | 37. Click show result button from the tool palette. | |
| − | + | '''Expected: Result looks like this ''' | |
| − | + | :[[Image:Populations.jpg]] | |
| − | + | 38. Click on Foxes at end node again. Press ctrl+e to open it's attribute pane | |
| − | + | 38.5 Change definition to ' Max([2,Min([Foxes_surviving,Foxes_at_start])]) ' | |
| − | + | 39. Select 'Edit time' from the 'Definition' menu. | |
| − | + | 40. Change definition to sequence(1, 100, 1). | |
| − | + | 41. Press ''Ctrl+R'' to bring up result and select graph view | |
| − | + | '''Expected: Result looks like this''' | |
| + | :[[Image: Time.png]] | ||
| + | * Select Populations, click on the result button. | ||
| − | + | '''Expected:You should have the same result as the screen shot below''' | |
| − | + | :[[Image:Populations end.jpg]] | |
| − | + | * Leave this model open and continue with [[Creating a frame node]] | |
| − | [[ | + | ==See Also== |
| + | * [[Tutorial: Dynamic system model]] | ||
| + | * [[Creating the Foxes and Hares model (based on chapter 7 of tutorial)]] | ||
Latest revision as of 00:49, 30 November 2022
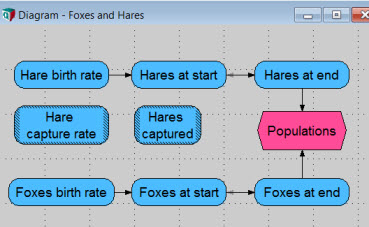
1. Drag two variable nodes in the diagram, type ‘Hare capture rate’ and ‘Hares captured’ for the title.
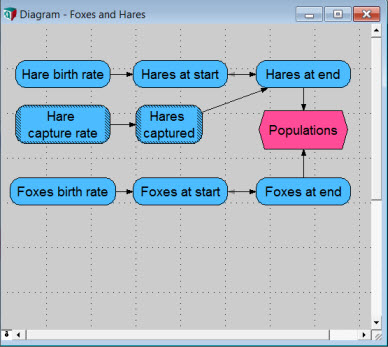
2. Draw arrow from ‘Hare capture rate’ to ‘Hares captured’.
3. Draw arrow from 'Hares captured' to 'Hares at end'.
4. Double click on Hare capture rate to open its object window.
5. In the Description field type ‘Percentage of hares captured by each fox during a time period.' Press Alt+Enter to go to the definition field.
6. In the Definition field type ‘25%’, press alt+enter.
Expected: Your object window should look like the screen shot below
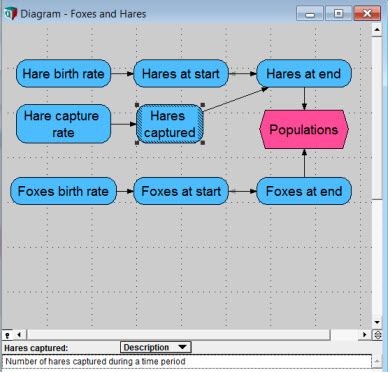
7. Select Hares captured. Select Description from the Attribute pulldown menu in the attribute pane. Type ‘Number of hares captured during a time period’.
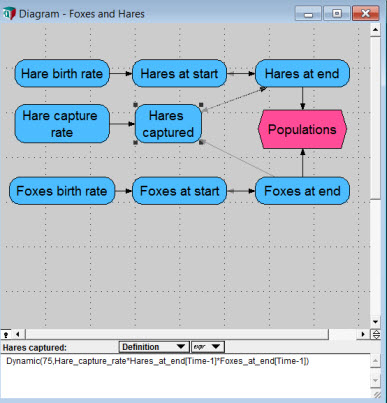
8. Draw arrows from both ‘Hares at end’ and ‘Foxes at end’ to ‘Hares captured’.
Expected: Your diagram should look like the screen shot below.
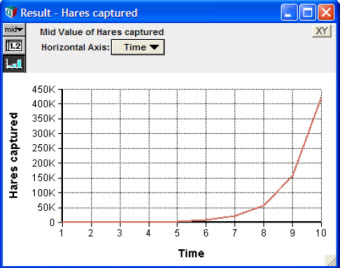
9. Select Hares captured. Select Definition from the Attribute pulldown menu, type Dynamic(75,Hare_capture_rate*Hares_at_end[Time-1]*Foxes_at_end[Time-1]). Press alt+enter.
10. Click on the result button.
Expected:Result window should appear.
11. Close the Result window.
11.1 Select Hares at end on the diagram
11.2 In the Attribute panel, edit the definition of Hares at end and change it to ' Hares_at_start - Hares_captured '.
12. Select 'Hares captured' press ctrl+e to open its attribute panel.
13. In the Attribute pulldown menu select Definition. Copy and paste this: Dynamic(75,Min([Hares_at_start-20,Hare_capture_rate*Hares_at_end[Time-1]*Foxes_at_end[Time-1]]))
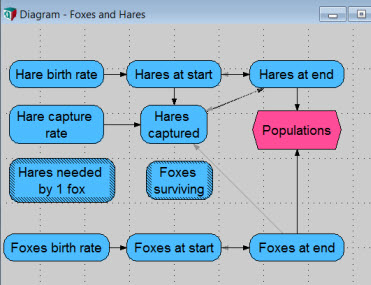
14. Drag and drap 2 variable nodes, give it a title 'Hares needed by 1 fox' and 'Foxes surviving'
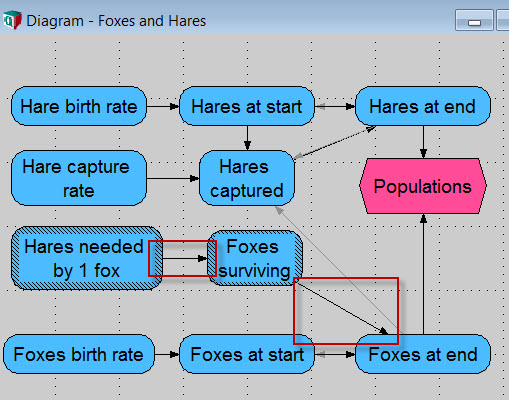
16. Drag arrow tool from 'Hares needed by 1 fox' to 'Foxes surviving'
17. Drag and drop the mouse from 'Foxes surviving' to 'Foxes at end' to create an arrow.
19. Double click on 'Hares needed by 1 fox' node to open it's object window
20. Click on Identifier field and change identifier to 'Hares_needed'
21. Press tab to go to 'Description' field
22. Type 'Number of hares that one fox must capture in a time period to survive'
23. Press tab key again to go down to 'Definition' field
24. Set definition to 10
25. Click on green arrow check box to accept definition. Close the Object window.
26. Double click on 'Foxes surviving' node to open it's object window
27. Click on tab key to go down to Description attribute and copy and paste this without the quotes 'Number of foxes surviving a time period, by eating the number of hares captured'
28. Press Alt+Enter to move down to Definition field
29. Key in 'Hares_captured/Hares_needed'.
30. Press green check button to accept definition.
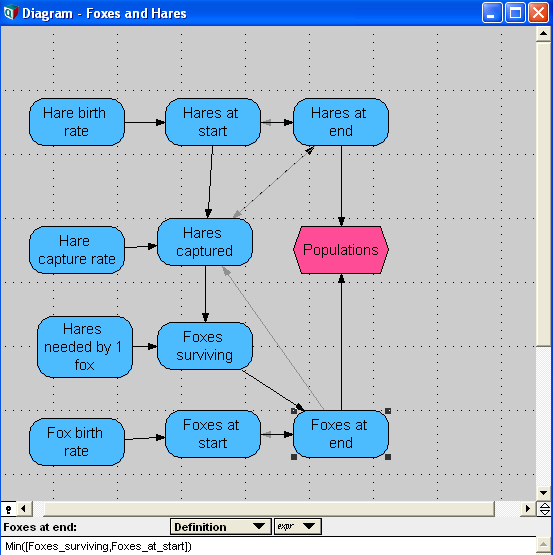
31. Close Object window.
Expected: Diagram looks like the screen shot below
32. Click on 'Foxes at end'.
33. Press ctrl+e to open it's attribute pane.
34. Key in 'Min([Foxes_surviving,Foxes_at_start])'
35. Click on check button to accept definition
36. Click 'Population' node.
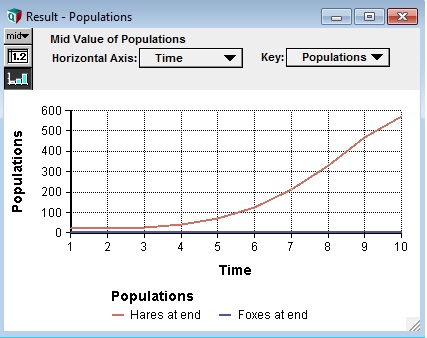
37. Click show result button from the tool palette.
Expected: Result looks like this
38. Click on Foxes at end node again. Press ctrl+e to open it's attribute pane
38.5 Change definition to ' Max([2,Min([Foxes_surviving,Foxes_at_start])]) '
39. Select 'Edit time' from the 'Definition' menu.
40. Change definition to sequence(1, 100, 1).
41. Press Ctrl+R to bring up result and select graph view
Expected: Result looks like this
- Select Populations, click on the result button.
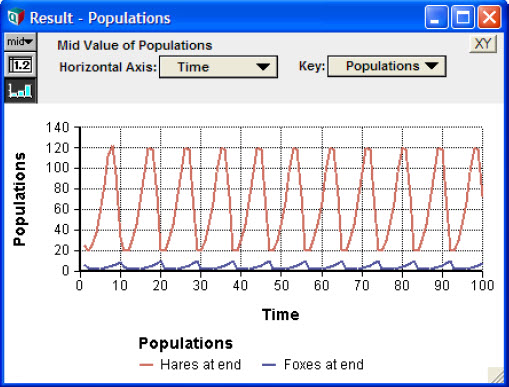
Expected:You should have the same result as the screen shot below
- Leave this model open and continue with Creating a frame node




Enable comment auto-refresher